Introduction
The crisis is in plain sight.
You see it as well.
You do not have to live on Wall Street or work in one of the AI labs in order to see it. I see it from Aarhus, in Denmark, on the same screens and in the same newspapers as everybody else. It is on the front page of The Wall Street Journal almost every week, it is in every earnings call of every large technology company, and it is in the chart of every stock which includes the word “Semiconductor”. This is the most visible crisis in the history of the stock market. And it has not even happened yet.
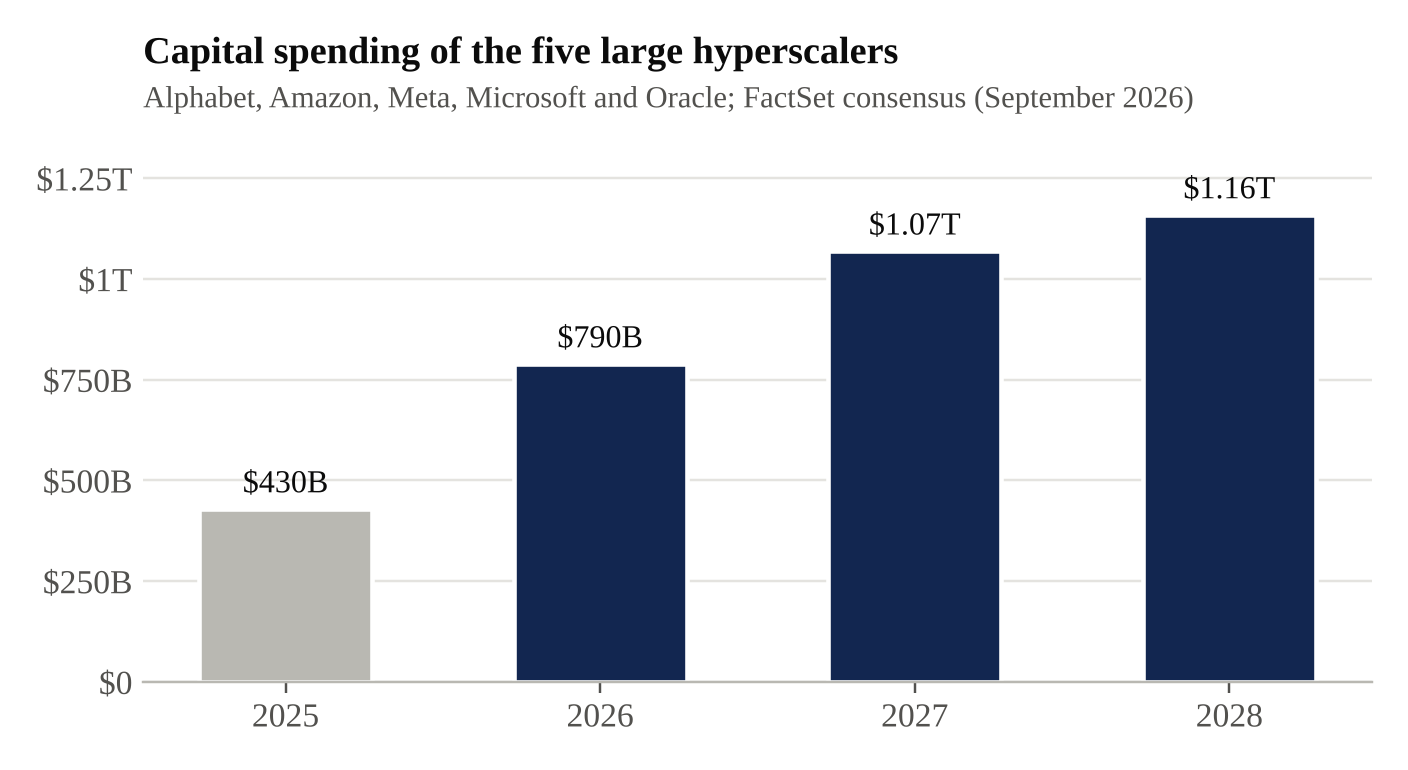
Over the past year, the talk in the markets moved from hundreds of billions of dollars of AI spending to trillions. In February 2026, four U.S. tech giants (Microsoft, Meta, Amazon and Alphabet) were planning to spend up to $670 billion on AI infrastructure in that year alone. By the autumn, the consensus for the five largest hyperscalers was around $790 billion for 2026, around $1.07 trillion for 2027, and around $1.16 trillion for 2028 (FactSet, via WSJ, 23 September 2026). The total U.S. investment in data centers and AI infrastructure is projected at $10.3 trillion between 2025 and 2032. Relative to the size of the economy, this is more than the railroads, more than electrification, more than the highways, and roughly three times more than the telecom and fiber build-out of the dot-com era. This will change your life forever. The Wall Street Journal simply called it “the biggest economic bet in U.S. history.”
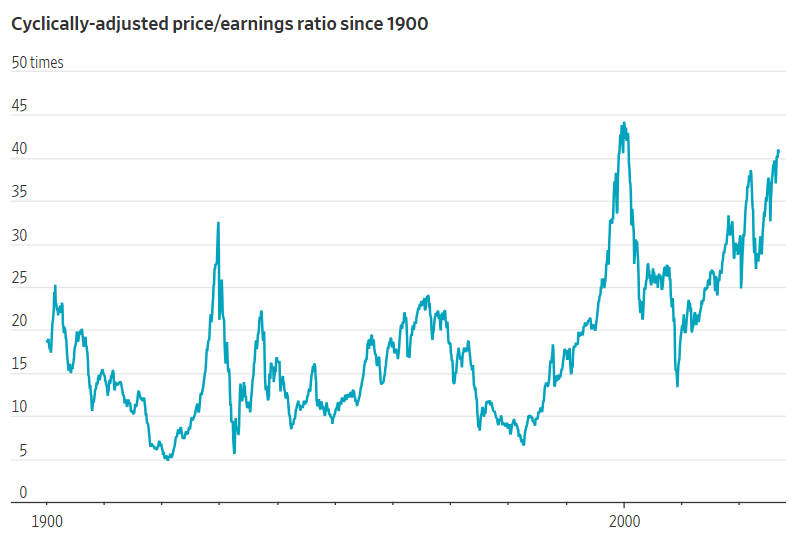
At the same time, the stock market is valued higher than at any point in my life. The Shiller CAPE of the S&P 500 is around 41. In the whole history of this measure, the only time when the S&P 500 was more expensive was the dot-com bubble. The S&P 500 set a new record of 7,844.67 in October 2026, while the Michigan consumer sentiment index sits close to the lowest level in its 70 years of surveys. The stock market is on the moon and the households are in gloom. This combination has never happened in this way before.
Everybody is now talking about the AI bubble. The newspapers write about it, the fund managers write about it, students at my university talk about it and even people who have never bought a single stock have an opinion on Nvidia. However, very few people have a real picture of how it could actually end. Most of them look at the parts of the AI boom which are easy to see: the record revenue of Nvidia, the growth of the cloud businesses, the new models which come out every few months, and the fact that they themselves use ChatGPT or Claude every day. These things are real. I see them too, and I use AI myself all the time, where it saves me work of two people.
However, the crucial defining factors of this boom are not as clearly visible. At only four hyperscalers, $2.4 trillion of lease and purchase commitments were not found on their balance sheets. Nvidia’s own debt jumped from around $8.5 billion to $33.4 billion in a single quarter, while its supply-chain commitments reached $279 billion. U.S.-dollar AI-related bond issuance reached around $420 billion in 2026 by the middle of October, nearly double the whole of 2025. Alphabet, Meta, Amazon and Tesla slid into negative free cash flow, and Microsoft is the only major AI spender which still produces positive free cash flow. Around 70% of the AI revenue of the hyperscalers comes from only two companies, OpenAI and Anthropic, which burn enormous amounts of cash and are at the same time in a price war with Chinese open-source models.
This is why I call it the most visible crisis. Everything which is needed to see it is published. It is in the 10-Q filings, in the S-1, in the bond data, in the reports of the Federal Reserve and in the articles of the journalists who follow it every day. However, the visible part of the boom (the stock prices, the earnings, the technology) is exactly the part which makes people feel safe, while the part which will decide how it ends (the debt, the circular deals, the commitments off the balance sheet) is hidden behind it. When the crisis comes, most people will say that nobody saw it coming. The truth will be that everybody could see it, but most people did not want to look.
Who I am and why I wrote this
My name is Simon Vosátka. I am 19 years old, I study at Aarhus BSS, the business school of Aarhus University in Denmark, and I am the fund manager of VosiCapital. I started to invest in the stock market when I was 12 years old. Seven years is not a long time for an investor, and I do not want to pretend that I have seen everything. I did not live through the dot-com bubble or through 2008 as an investor; I know them from books, from data and from the articles of the people who were there. However, I am old enough as an investor to remember the meme-stock year of 2021, crash of 2020 and High Rates with correction in 2022, where in my short time in the markets I have learned one thing which is more important than any number: markets can stay irrational for a long time, but the way a bubble is financed decides how it ends.
On 7 February 2026, I began an analysis of the AI bubble. At that time, the market showed the first small signs of nervousness. Amazon lost around $133 billion of market value in one day after it said it plans to spend $200 billion on AI-related costs in 2026, the software stocks were falling, bitcoin had lost more than 45% from its peak, and the first real discussions about the profitability of AI had started a few months earlier, in November 2025. I wanted to answer one simple question for myself and for my fund:
“Is the current AI boom in the stock market a bubble, and if yes, how and when could it burst?”
In order to answer it, I compared the AI market with the dot-com bubble point by point, from the expansion of the indexes and the valuations, through the IPOs, the young founders, the insider selling, the spending on infrastructure, the free cash flow, the debt and the bonds, to the retail investors, the fraud, the job market, the populism of the CEOs and the interest rates. Then I kept adding to the analysis as the year continued, through a war, a software crash, the largest semiconductor melt-up since the year 2000, a hike of the Federal Reserve and the first cracks in the financing of the boom.
This essay is based on that analysis. However, it is not a copy of it. The analysis was written as a working document, which I updated again and again whenever something important happened. This essay tells the whole story at once: from where it started, through everything which happened until today, the end of October 2026, and into the future, which could become the most visible crisis which nobody saw coming.
A note on Situational Awareness
In June 2024, Leopold Aschenbrenner, a former researcher at OpenAI, published a long essay called “Situational Awareness: The Decade Ahead.” It started with the sentence “You can see the future first in San Francisco,” and it argued that a few hundred people in the AI labs could see what was coming before everybody else: trillion-dollar compute clusters, a mobilization of American industry, and machines smarter than humans before the end of the decade. Whatever one thinks about his predictions, the essay was very influential, and it is one of the reasons why I decided to write this essay in this form.
After the essay, Aschenbrenner started a hedge fund under the same name. In 2026, the fund was famous as the most concentrated AI bull in the market, and The Wall Street Journal described it as a $45 billion powerhouse. In his essay, he had written, almost as a side note, that “going all-in leveraged long Nvidia in early 2023 has been great and all.” Two years later, the leverage was exactly what destroyed the fund. When its aggressive AI bets turned bad in July 2026, the heavy borrowing triggered demands from its lenders, and the fund had to sell the bulk of its public stock portfolio to Citadel (WSJ, 4 August 2026). Some of its big-name backers had warned him about the risks of borrowing so much. A fund which was even partly hedged, with billions of dollars of put options on chip stocks, was still liquidated.
I do not write this in order to laugh at him. He was right about many things in the technology, probably more than most people. However, his story shows the main idea of this essay in a small picture. You can be right about the technology and still be destroyed by the financing. The internet in 1999 was real, and the investors still lost around $5 trillion. AI in 2026 is real, and the same thing could happen again, only bigger, faster and with much more debt.
My claim
My claim is simple, and I will support it with data throughout this essay.
AI is a genuinely transformative technology, likely greater than the internet was when it came in 1999, and it will shape the future in many ways.
However, the investment wave around AI has become a bubble, and the bubble has a specific weakness. It is increasingly financed by debt, by promises which are not on the balance sheets, by circular deals in which the vendors finance their own customers, and by revenue which is concentrated in two labs that burn cash and are in a price war with China. At the same time, the window to raise new capital is narrowing: the Federal Reserve hiked rates in September 2026, the 10-year Treasury yield is above 5%, the first-day premiums of IPOs collapsed from 24% to under 1%, and the weakest borrowers, such as CoreWeave, pay yields of close to 15% on their bonds.
Therefore, the burst of the AI bubble is the most likely outcome. The open question is not if, but when and where it starts. The first domino will most likely not be Nvidia or one of the hyperscalers, but the weakest leveraged link of the chain, such as CoreWeave and the other neoclouds. The burst would be focused mainly on semiconductors, because chips are the place where the debt, the circular deals and the narrative all meet. And this decline may be closer than most people think.
The timing may be wrong, and the strongest counterarguments are presented throughout the essay, because some of them are very strong: the earnings of the chip makers are real and still exploding, Anthropic turned an operating profit in its second quarter, and the U.S. economy has shown again and again that it can shrug off wars, oil shocks, high rates and tariffs. A final pump before the burst is very possible. However, the longer I studied the data, the more my view was strengthened, not weakened.
What this essay is not
It is important to say clearly what this essay is not. It is not a prediction of a specific date, because nobody can know the day when a bubble bursts, and the timing is discussed only as a window. It is not an argument against AI, because the technology is real and useful. It is not an attack on the people who work in the AI labs, many of whom are building something extraordinary. And it is not investment advice. It is an analysis of how the money around AI is organized, why this organization is fragile, and what could happen when it breaks.
How this essay is built
This essay will, firstly, look back at the dot-com bubble and the other great technology manias, which give us a checklist of what a bubble looks like and how it ends (Chapter I). It will then describe where the AI market stood on 7 February 2026, when I began my analysis, and why at that time I still believed the market was in a phase of digestion and not in a burst (Chapter II). Continuing with the spring of 2026, when a war, a crash in software and a ceasefire turned into the most violent melt-up of chip stocks since March 2000 (Chapter III). The essay will then follow the money behind the boom: the spending on the build-out, the circular deals, the negative free cash flow, the debts off the balance sheets and the flood of bonds (Chapter IV), and the two labs, OpenAI and Anthropic, which carry the revenue of the entire system on their backs (Chapter V). After that, it will describe the summer and autumn of 2026, when money stopped being cheap and the weakest links started to crack, including private credit, the shadow lender of the data centers (Chapter VI), and the social side of the bubble, the K-shaped economy, in which the owners of AI assets get richer while the workers and the retail investors carry the risk (Chapter VII). Finally, it will describe how the most visible crisis could unfold (Chapter VIII), and finish with my parting thoughts (Chapter IX).
The analysis began on 7 February 2026. Everything after that date in this essay happened in front of everybody’s eyes.
Chapter I
From 1999 to 2026: The Ghost of the Dot-Com Bubble
“History doesn’t repeat itself, but it rhymes”.
The dot-com bubble gives us a checklist of what a technology bubble looks like and how it ends: fast index expansion, extreme valuations, a flood of IPOs, young founders, insider selling, a giant build-out financed with debt, retail euphoria, celebrity CEOs and, at the end, a Federal Reserve which raises rates. The internet was real. The investors still lost.
Nvidia’s growth is better than Cisco’s was, but both were extraordinary: In 1999 Cisco’s revenue expanded more than 40% and in 2000 more than 50%.
The Wall Street Journal
I was born after the dot-com bubble burst. For people of my age, the year 2000 is history, the same as 1929 or the railway mania of the 1840s. However, when I started my analysis in February 2026, it became clear to me very quickly that I could not understand the AI market without understanding the last great technology bubble in detail. Not because history repeats itself exactly, but because the people, the incentives and the mistakes are very similar every time. Before looking at the AI bubble, this chapter therefore describes the dot-com bubble as a benchmark, in the same way as I used it in my analysis.
The rise
The dot-com bubble lasted roughly from 1995 to its peak in March 2000, followed by a crash which lasted until 2002. It was a classic speculative mania, driven by a transformative technology (the commercialization of the internet), together with easy capital, a large participation of retail investors and a disregard for fundamentals. The Nasdaq rose by around 600% from 1995 until its peak of 5,048.62 on 10 March 2000. In the last two to three years before the peak, the Nasdaq went from around 1,300 to 4,300, which is around 3.3 times. The S&P 500 went from around 1,000 to 1,500 in two years.
The reasons for the rise are easy to understand from today’s perspective. The internet was being commercialized and adopted very widely, with browsers, e-commerce and portals. Interest rates were low to moderate in the early phase, with the Fed funds rate around 4% to 5% in the late 1990s, venture capital was easy to get and the IPO market was in a frenzy. There was a “New Economy” narrative, where metrics like “eyeballs” and page views, together with the future potential, were more important than traditional fundamentals such as profits and cash flow. The Y2K remediation spending boosted the demand for technology, and the deregulation through the Telecom Act of 1996 spurred a hype in infrastructure. Online brokerages such as E-Trade and 24-hour media such as CNBC brought a large number of new retail investors to the market. Finally, there was the massive telecom and internet build-out of fiber optics, switches and wireless networks, which created a circular optics of demand: one company’s spending was another company’s revenue.
Replace “internet” with “AI”, “eyeballs” with “tokens” and “fiber” with “GPUs”, and this list becomes an almost perfect description of the years 2023 to 2026. This was the first moment in the analysis which showed how much the two eras rhyme.
The crash
The downside came from several directions. Firstly, the Federal Reserve raised the Fed funds rate from around 4.7% in early 1999 to 6.5% by May 2000. Higher rates raised the cost of borrowing and made safe assets more attractive in comparison to speculative stocks. Secondly, the industry realized that it had built far too much. The fiber optic build-out vastly exceeded the demand, which became known as “dark fiber”, cables in the ground which nobody used. Thirdly, the reality of earnings and cash burn was exposed. In March 2000, Barron’s published its famous article “Burning Up”, which showed that 74% of the surveyed internet companies had negative cash flows, and that Amazon, at its peak valuation, had cash for only around ten months.
After that came the accounting scandals and the fraud: Enron in October 2001, WorldCom in June 2002, Adelphia and others. There were also macro signals, such as the recession in Japan in March 2000, the slowdown of the U.S. economy and the forced selling after Tax Day in April 2000. The 9/11 attacks in 2001 accelerated the declines. And finally, the liquidity dried up: venture funding collapsed and the overleveraged companies could not refinance their debt.
The consequences were brutal. The Nasdaq fell by 78% by October 2002 and around $5 trillion of market value was erased. The S&P 500 declined for two years and lost around 45% of its value, while the Nasdaq-100 lost around 80%, which means that the technology index fell significantly faster than the broad market. Many companies failed completely: Pets.com, Webvan, Boo.com and theGlobe.com became symbols of the era. Even the survivors, such as Cisco and Amazon, suffered drawdowns of 80% to 95%, and it took the Nasdaq around 15 years to reclaim its highs.
The most important lesson is in this last sentence. The internet delivered huge long-term value. It changed how people shop, communicate, work and invest. However, the investors who bought at the top did not see that value for fifteen years. The technology won and the investors lost. This is the central idea which I kept in my mind for the whole year of 2026.
The checklist
From the history of the dot-com bubble, I created a checklist which became the structure of my analysis. Every point on it is something which appeared before the burst in 2000, and in many cases also before 2008. The rest of this chapter goes through the most important points, because they come back again and again in the rest of this essay.
Profitability discussions and the IPO wave
The first major wave of reports and discussions about the profitability of internet companies intensified in late 1999 and early 2000, and peaked with the article of Barron’s in March 2000. Before the bubble, the hype focused only on the potential for growth. After the peak, profitability became the central debate, as the valuations were completely detached: many companies traded at 50 to 200 times their sales without any profits.
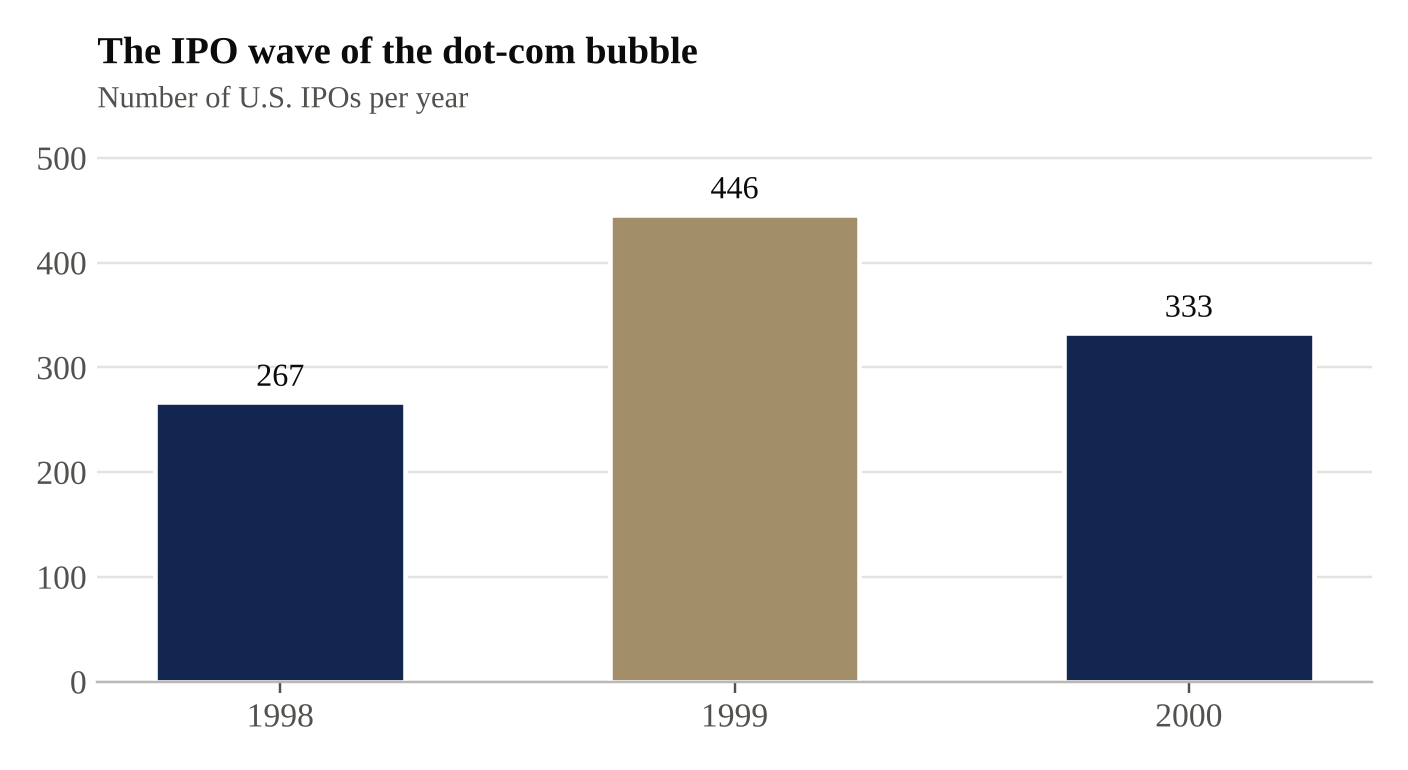
At the same time, the number of internet IPOs exploded. In 1998 there were around 267 IPOs in total, in 1999 there were 446, many of them connected with the internet, and 39% of all venture capital went to internet companies. In 2000 there were still 333. The average first-day jump of an internet IPO in 1999 was around 106% to 266%, compared with 59% for companies outside of the internet. According to data from the University of Florida, only around 14% of the technology and internet IPOs were profitable at the peak. Most of them operated with heavy losses, burned cash on advertising and branding, and offered free or discounted services with the hope that they would make money from them in the future.
Young founders
Many of the companies were founded by very young entrepreneurs. The most famous example is theGlobe.com, founded by two students at Cornell, and there were many “garage” startups. Most of these new startups were not profitable and lived from the money of venture capital and the IPO proceeds. Young founders who raise huge amounts of money without a profitable business are one of the clearest signs of a late-stage bubble, because they show that the capital is so easy to get that experience and a business plan are no longer necessary.
Insiders selling
Before the crash, the insiders sold. The CEO of Cisco, John Chambers, and other executives sold shares during the run-up in 1999 and early 2000, and their Form 4 filings show millions of dollars in proceeds. Cisco briefly became the most valuable company in the world, and after the crash it was hit hard by inventory write-downs and pressure on sales. There was no outright fraud at Cisco, but the selling signaled caution at the peak of the hype. At Enron, the executives such as Ken Lay and Jeffrey Skilling sold tens and hundreds of millions of dollars of shares before the collapse, while the company hid debt and inflated its earnings with special purpose entities. In telecom, the selling was even larger: Joseph Nacchio of Qwest sold around $248 million, Gary Winnick of Global Crossing around $748 million and Philip Anschutz around $1.9 billion.
The build-out, the cash flow and the debt
The telecom companies alone invested more than $500 billion between 1996 and 2001, which is more than $900 billion in today’s money, in fiber optics, switches, wireless networks and data infrastructure. They overbuilt the capacity drastically, the demand lagged behind, and the result was dark fiber. Most of the companies had negative or minimal free cash flow. Some, like Cisco, had stronger cash positions before the crash, but the free cash flow of the sector deteriorated as the spending outpaced the revenue.
The build-out was financed heavily with debt. The corporate bond market boomed, and the companies issued more bonds than usual in order to raise capital in the euphoria. The high ratios of debt then triggered the bankruptcies of companies such as WorldCom and Global Crossing. One small detail from this time is very telling: the 100-year bonds. Century bonds are issued when money is easy. The first wave came in the mid to late 1990s, when companies paid a lower yield compared with safe Treasurys than at any time since. Motorola issued the last technology 100-year bond of that time, and Coca-Cola issued the last of these 100-year bonds in May 1998. Soon after that, the hedge fund Long-Term Capital Management imploded, and the cost of corporate debt compared with Treasurys jumped. Remember this detail, because in early 2026, Alphabet issued a 100-year bond.
Retail investors, fraud, jobs and the rock-star CEOs
Online trading democratized access to the stock market. The day-trading boom brought more retail investors, including many people who had never invested before, through brokerages and the hype of CNBC. The cash levels of investors were at record lows. The best example is E-Trade Financial, which rose by 261% in 1999 alone.
The fraud was mainly revealed after the burst: Enron, WorldCom and Adelphia, the abuse of revenue recognition and entities off the balance sheets. Before the crash, the hype masked these problems and the oversight was relaxed. This is an important pattern. The fraud is created during the bubble, but it is discovered only when the money stops flowing.
The labor market was tight in the late 1990s, with an unemployment rate of around 4% and a boom of technology jobs, which turned into massive layoffs in technology and telecom after the burst, in the recession of 2001 and 2002. And the CEOs became celebrities. The leaders of the dot-com era, such as Steve Case of AOL and John Chambers of Cisco, were treated like rock stars, and their interviews and wealth stories in the media fueled the hype even more.
Interest rates
The Fed funds rate was around 4.75% to 5.5% through much of the late 1990s, and then a series of hikes in 1999 and 2000 brought it to 6.5%, which contributed to the burst by tightening the financial conditions. The dot-com bubble was not killed by one bad article or one failed company. It was killed when the cost of money went up at the moment when the companies needed more money than ever.
Eyeballs and tokens
There is one more similarity which is less visible in the numbers but very important for understanding a bubble: the way in which success is measured. In the dot-com era, the companies and the analysts measured “eyeballs”, page views and the number of users, because the profits were not there. These metrics were not useless, as they did show that people were using the internet. However, they were used to justify valuations which assumed that every user would one day become very profitable, and for most companies this never happened.
In the AI boom, the equivalent metrics are tokens, inference, users of chatbots and the “annualized run-rate” of revenue. Again, these metrics are not useless. They show that people and companies really use AI, and I am one of them. But they are used in the same way as the eyeballs were used in 1999: to justify the spending today with the profits of the future. The run-rate is a good example. It takes the revenue of the best recent month or quarter and multiplies it, so it is always the most optimistic picture of a company. When I read in October that the run-rate of OpenAI was around $20 billion lower than had been reported, because of a different method of calculation, I immediately thought of the eyeballs of 1999. A metric which can be calculated in two ways, with a difference of $20 billion, is a metric of the narrative and not of the business.
The last weeks before the top
The final phase of the dot-com bubble was not slow. In the ten weeks before 10 March 2000, the technology stocks rose faster than at any time before. The semiconductor stocks had one of their strongest months ever in February 2000, and some of the fastest runs of the chip stocks in history happened in the last weeks before the peak. This is an important pattern which is easy to forget: manias do not usually end with a slow decline after a long period of calm. They end with an acceleration, a last phase in which the prices rise faster and faster on good news, with a bang and not a whimper, until the moment when the financing stops.
This pattern became very important in 2026. As I will describe in Chapter III, almost every velocity record which the semiconductor index set in the spring of 2026 had its twin in the ten weeks before March 2000. The record which was broken in May 2026, the best first 100 trading days of a year, had stood since 1995, and the other records had stood since February and March 2000. A record of speed alone does not prove a top. However, when the speed of a market matches the final weeks of the biggest technology bubble in history, it is a signal which no serious investor should ignore.
Cisco and Nvidia
There is one comparison which I have read again and again in 2026, and it is the comparison between Cisco and Nvidia. Cisco was the “picks and shovels” company of the internet. It sold the routers and switches which every internet company needed, it had real revenue, real profits and an extraordinary growth: its revenue expanded more than 40% in 1999 and more than 50% in 2000. It briefly became the most valuable company in the world. And after the crash, its stock fell by more than 80%, even though the company survived and remained profitable.
Nvidia today is the “picks and shovels” company of AI. It sells the GPUs which every AI company needs, it has real revenue, real profits and a growth which is even better than Cisco’s was. This is the point. A company can be a great business and still be a bad investment at the wrong price, because its revenue depends on the spending of its customers, and the spending of its customers depends on the availability of capital. When the capital stops, the revenue of the “picks and shovels” company falls at the same moment when the market decides that its valuation was too high.
Older bubbles and the same disappointment
The dot-com bubble is not the only example. Our world went through the long history of technology manias, from the canal mania of the 1790s and the railways in the 1840s, to electrification, radio, television and the fiber of the dot-com era. The conclusion became rather more than often similar. Each case the technology delivered for society, but “investors were sorely disappointed.” The benefits came too late, the profits were smaller than expected, or the competition passed the gains to the users and not to the owners.
This is a very important point which many people miss. A bubble is not a statement that the technology is useless. The railways changed the world and many railway investors were ruined. Electricity changed the world, and the investors in the early electric companies were disappointed. The internet changed the world, and the Nasdaq needed fifteen years to come back. The question for an investor is never only “Is this technology real?” but also “Who will capture the money, when, and at what price?”
There is also a second history which matters for this essay, and it is 2008. The financial crisis of 2008 was not caused by a new technology but by debt, by opacity and by a financial system which was more connected than anybody admitted. “Mackintosh” from WSJ made a striking comparison: in 2007, the bubble in bank stocks was hidden by overstated book values, in the same way as today the earnings of many companies are inflated by the AI spending of other companies. In 2007, the failure of Freddie Mac to raise common equity signaled the end. And the private credit market of today has a size comparable to subprime mortgages at their peak, around $1.5 trillion. I will come back to all of this in Chapter VI.
The differences
It would be dishonest to show only the similarities. In February 2026, there were several important differences between the dot-com bubble and the AI boom, and at that time I took them very seriously.
The first and most important difference was profitability. The leaders of the AI boom, the hyperscalers and Nvidia, generated huge revenue and profits, with proven (if lumpy) demand. Nvidia had gross margins of more than 70%. In the dot-com bubble, most of the hyped companies had little or no earnings. Secondly, the valuations of the leaders were high, but not as extreme as in 2000. The P/E ratios of the Nasdaq in the dot-com bubble reached around 200 times, while the AI leaders traded at around 50 to 100 times. Thirdly, the leaders had huge piles of cash, around $200 billion and more combined, and they funded a large part of their spending from their own cash flow, while the dot-com companies relied heavily on external debt and venture capital. Fourthly, the interest rates were lower than in the late 1990s and, in February 2026, they were expected to fall further.
These differences were the reason why, at the start of my analysis, I did not believe that a burst was close. Over the following months, almost every one of these differences became weaker. The profits stayed real, but the cash flow turned negative. The cash piles stayed large, but the companies started to borrow. The interest rates did not fall; the Federal Reserve raised them. The difference which remained is the profitability of the leaders, and even there, a large part of the profit of one company is the spending of another.
Why the checklist matters
The checklist of the dot-com bubble is not a perfect tool. No two bubbles are the same, and the timing of a burst cannot be read from a list. However, it gave me a way to look at the AI market point by point, without being carried away by the narrative from either side, from the people who say “it is just like 1999” and from the people who say “this time is different.” In the following chapters, I go through the same points for the AI bubble, in the order in which they developed in 2026.
On 7 February 2026, the checklist already looked worrying. By the end of October, almost every point on it was flashing.
Chapter II
7 February 2026: The Starting Point
In February 2026, the AI market looked like the late 1990s on almost every point of my checklist: doubled indexes, valuations at dot-com levels, extreme concentration, a record amount of money for startups without products, insiders selling, and the first serious questions about profitability. However, there was one big difference: the leaders were profitable and rich in cash. My conclusion at the start was that the market was in a “prove it” phase, a digestion, and not a burst.
The way I would describe it is that there are some ideas that I think are promising and I want to investigate them.
Ilya Sutskever, on raising money for his new AI start-up (Dwarkesh Podcast, November 2025)
The current AI bubble did not start in 2026. It emerged around the end of 2022, with the launch of ChatGPT on 30 November 2022. It accelerated sharply in 2023 and 2024 on the spending of the hyperscalers and the first pilots of AI in companies, and it reached its peak valuations and concentration in late 2025 and early 2026, when the Nasdaq stood around 24,700 and the Magnificent Seven dominated everything. When I began my analysis on 7 February 2026, the market showed a small downside and more volatility than before, as investors started to question the spending. This chapter describes what I saw on that day, point by point, because everything which happened later is connected to the start.
The indexes and the valuations
The first point on my checklist was the expansion of the indexes. In the dot-com bubble, the Nasdaq rose around 3.3 times in two to three years. In February 2026, the Nasdaq had risen from around 12,000 to 24,700 in three years, which is around two times, and the S&P 500 had gone from around 4,000 to 6,600. This was less extreme than in the dot-com bubble, but the concentration was much higher. Today, the whole index depends on a small group of companies, mainly the Magnificent Seven and the semiconductor companies.
The valuations were very similar to the dot-com era. When I compared the P/E ratios of the S&P 500 and of the Nasdaq-100 with their history, the current levels were at the same height as around 2000, and the 12-month forward P/E ratio of the S&P 500 showed the same values as in the dot-com bubble, which historically suggested a red flag. Moreover, when I compared the S&P 500 with the equal-weighted version of the same index, the gap between them had been significantly growing for three years. This means that the index was driven mainly by technology stocks, while the average company in the index did much worse. The small companies of the Russell 2000 were also lagging behind. In the dot-com bubble, the technology sector also carried the performance of the whole index, but at that time the technology sector was broader. Today, the technology sector is mainly the Magnificent Seven plus the semiconductors, and the S&P 500 is much less diversified than it looks. This suggests a higher volatility in the case of a crisis, because when the few largest companies fall, there is nothing big enough to hold the index up.
The spending
The second point was the spending on the AI build-out. In February 2026, four U.S. tech giants, Microsoft, Meta, Amazon and Alphabet, were planning to spend up to $670 billion on AI infrastructure in 2026 alone, as they were scrambling to increase the computing power needed to operate and scale their AI businesses. The quarterly spending of these companies had increased three to four times in a few years, the build-out of data centers had increased drastically, and the spending in 2026 was supposed to be around one third higher than in the already very high year of 2025. Moreover, five big tech companies were projected to spend around $3 trillion on property and equipment over the next four years.
What was new in February was the reaction of the market to this spending. In 2025, every announcement of higher spending on AI was rewarded by a rising stock price. In February 2026, it was the opposite. When Amazon said that it plans to spend $200 billion on AI-related costs in 2026, its shares slid by 5.6%, which was a loss of around $133 billion of market value, and Alphabet fell by 2.5% after its own spending plans. The market started to ask the most important question of the whole AI boom: where will the return on this money come from?
OpenAI and the circle
The third point, and already in February the most dangerous one, was the circular financing of the AI companies. The hyperscalers and the AI labs were making reciprocal investments and contracts, which created the optics of revenue and of future orders, but also a strong dependency on each other.
The center of this circle was OpenAI. With an annualized revenue run-rate of around $20 billion targeted by the end of 2025, up from around $3.5 billion in 2024, the company remained unprofitable and in a permanent mode of fundraising. According to a report of Moody’s from December 2025, its total commitments were around $1.4 trillion over eight years. This figure was around seventy times its revenue and relied on the partnerships with the hyperscalers for compute, equity and revenue.
The largest single example was Oracle. OpenAI signed a compute contract with Oracle worth around $300 billion over five years, which was supposed to start around 2027. This deal drove a 359% surge in the remaining performance obligations of Oracle, and it was widely known that it accounted for much of the AI backlog of Oracle. However, it was far from certain that OpenAI could pay the full amount. The stock of Oracle had already fallen by 43% from its all-time high in September 2025, because investors had “grown uneasy about the circular nature of many of the AI sector’s dealings” and were “looking askance at huge gains in RPOs.” In early February 2026, Oracle fell another 5% on doubts about OpenAI, and on 1 February, Oracle said that it plans to raise $45 to $50 billion through equity and debt in 2026, including as much as $20 billion of common stock, in order to expand its cloud business. HSBC estimated that OpenAI needs $207 billion of new funding by 2030 only for the expansion of data centers in order to honor such contracts.
The other partners were also deeply exposed. Microsoft was the largest shareholder of OpenAI, with a stake of around 49% after investments of more than $13 billion since 2019, and its exclusive cloud provider, where around 10% of the revenue of Azure came from OpenAI. Nvidia had announced a strategic partnership with OpenAI in September 2025 for 10 gigawatts of systems, including a planned investment of up to $100 billion, but by February 2026 there were reports that the deal had been partly pulled back. SoftBank held around 11% of OpenAI, had injected $34.6 billion in total, including $22.5 billion in December 2025, and was in talks for up to $30 billion more. Amazon and Alphabet provided additional compute under multi-year deals worth around $50 to $100 billion combined, and CoreWeave and AMD added smaller contracts for GPUs. In total, the exposure of the partners to OpenAI was more than $500 billion of locked-in capacity. At the same time, CoreWeave and other smaller companies were buying chips from Nvidia, which also financed them.
OpenAI itself was burning around $5 to $7 billion per quarter, despite the growth of its revenue. How it would pay for $1.4 trillion of commitments was, as analysts said, a trillion-dollar question. The competition was also showing internal pressure: xAI had lost four of its twelve co-founders in late 2025.
The circular deals blur the line between a customer and a vendor. When Nvidia invests in a company which then buys Nvidia’s chips, the revenue of Nvidia grows, but part of that revenue is Nvidia’s own money coming back. When OpenAI signs a contract with Oracle, the backlog of Oracle grows, but the backlog is only as good as the ability of OpenAI to pay. This structure amplifies the risk of a chain reaction if the monetization fails.
The profitability debate and the IPOs
The fourth point was the discussion about profitability. The first major wave of reports and discussions about the profitability of AI companies began around November 2025 and intensified into 2026, as the scrutiny of the spending and the debates about the return on investment grew. This is a direct parallel to the dot-com bubble, where the profitability debate came in late 1999 and early 2000, shortly before the peak.
The IPO market was also growing again. In 2025, the global IPO proceeds rose by 39% to $171.8 billion, with a strong focus on AI, and the U.S. saw around 347 IPOs including SPACs, up 54% compared with 2024. CoreWeave had listed, Databricks was preparing, and the narrative was dominated by AI-native and infrastructure companies. The majority of the new companies were without revenue or with minimal revenue at the time of their IPO, and only a few, roughly in the low teens of percent, were truly profitable at their debut. At the same time, the U.S. government tried to address the long decline in the number of listed companies by relaxing the rules for small public companies, which creates a persistent risk of more stock scams.
On the list of upcoming IPOs were SpaceX, Anthropic and OpenAI. In February, I wrote that these listings could be read as a positive signal of the sector’s maturity, but also as a classic extension of the bubble. A successful debut could reignite the fear of missing out of both retail and institutional investors and drive the AI valuations higher in the short term. However, if they were priced at their private valuations, they could amplify the concentration and set up a sharp decline after the IPO. History shows that late-cycle waves of IPOs often mark the turning points.
Money for ideas
“No Profit, No Revenue, No plan, …”
The fifth point was the young founders and the startups. In 2025, U.S. AI startups raised a record $222 billion. Most of this money went into research and scaling with very uncertain paths to profitability. Some examples from the beginning of 2026 show the atmosphere very well. Flapping Airplanes raised $180 million at a valuation of $1.5 billion from investors including GV, Sequoia Capital, Index Ventures and Menlo Ventures, while one of the people behind it had taken leave from a Ph.D. program only a few months earlier. Humans& raised $480 million at a $4.48 billion valuation in January in order to build AI systems which help people collaborate. Reflection AI raised $2 billion at an $8 billion valuation to build an open-source model, and Periodic Labs, which aims to automate scientific research, launched with $300 million of funding. In another start-up, the co-founders included a 21-year-old Thiel Fellow (a program which pays college students to drop out and pursue their own projects) and an 18-year-old high-school student.
The best example of this mood was Ilya Sutskever, one of the most famous researchers in AI, who raised money for his own start-up. In a podcast in November 2025, he said that “there are some ideas that I think are promising and I want to investigate them,” without any promise that these ideas would lead to a breakthrough, a product or revenue. He also said that AI is returning to an “age of research” after the period of scaling between 2020 and 2025. I have deep respect for his work. However, from the perspective of an investor, this is the definition of a late-stage bubble: companies with no plan, no product and no profit raising billions of dollars, and teenagers founding companies with valuations of hundreds of millions. In the dot-com bubble, it was theGlobe.com and two Cornell students. In 2026, it was a Thiel Fellow and a high-school student.
As I am 19 myself, I am aware how this sounds. Young people can build great companies. However, when capital is so easy to get that a high-school student can raise money at a large valuation before having any revenue, the problem is not the student. The problem is the capital. The market has seen this before.
The insiders
The sixth point was the insider activity, and the picture was clear. Across Nvidia, AMD, Palantir, CRWV and others, there was heavy net selling and no material buying, mostly through automatic 10b5-1 plans. At Nvidia, insiders sold more than $100 million in 2026 by early February, including multiple tranches of the CFO Colette Kress in January and February, with more than $8 million on 4 February alone. In the previous twelve months, around $1.79 billion of shares were sold by more than fifteen insiders, and Ajay Puri sold around $36 million in January. At AMD, the CEO Lisa Su sold around $26.9 million in December 2025, and other executives sold millions in late 2025 and January 2026. At Palantir, more than $9 million was sold in 2026 by early February, including around $3 million by the director Alexander Moore on 2 February.
To be fair, a large part of this selling is planned in advance and does not necessarily mean that the insiders expect a crash. However, the pattern accelerated compared with late 2025, and the absence of any meaningful buying is a signal in itself. In the dot-com bubble, the executives of Cisco also sold through the run-up, and Cisco was also a great company.
The cash, the debt and the century bond
The seventh point was the free cash flow and the debt, and here the picture in February was still mixed. The free cash flow of the Magnificent Seven was getting smaller because of the intensity of the spending, with the exception of Nvidia, and the net debt was increasing. The leaders were still rich in cash in comparison to the dot-com era, but there was a clear shift towards financing with debt.
The companies had started to issue more bonds than usual in order to raise capital for the build-out. CoreWeave priced a $2.25 billion convertible bond, a type of financing with a lower interest rate than the asset-backed financing which the company typically used to pay for new data centers, but with the risk of diluting its shareholders. And Alphabet issued a 100-year bond. As I described in the previous chapter, century bonds are issued when money is easy, and the last wave came in 1997 and 1998, right before the collapse of Long-Term Capital Management and two years before the top of the dot-com bubble.
In February, the large companies still looked stable. The leading hyperscalers and Nvidia were highly profitable, with strong balance sheets, high margins and internal cash funding a large part of their spending. The AI contributions of the cloud businesses already represented a large share of their revenue, for example around 23% at Google Cloud and around 10% at Azure, and Goldman Sachs forecast that AI could add 7% to the global GDP over the next decade. However, I also noted that a large number of companies looked positive only through the circular financing, and that the companies which were left out of it already showed weakness. Hewlett Packard Enterprise, for example, reported lower-than-expected revenue because its customers were hitting delays in the development of their AI products, and some of its large customers “weren’t ready to receive and pay for the company’s products on time,” as its CFO Marie Myers said.
Retail investors and fraud
The eighth point was the participation of retail investors. In 2025, the trading boom powered the stock of Robinhood up by 220%, just as the dot-com trading boom powered E-Trade up by 261% in 1999. Everyday people, teachers and people who had never talked about investing before were talking about stocks, gold, silver and crypto, and the cash levels of investors were at record lows. Historically, the increase of interest in the stock market among people with lower incomes occurs before peak.
The ninth point was fraud. There were warnings about a rise of fraud in the boom, for example from the short seller Jim Chanos, who talked about the potential for fraud on a “diamond” or “platinum” level, with parallels to the time after Enron. The enforcement against “AI-washing”, companies which claim to use AI more than they actually do, was increasing, with more SEC cases in the fiscal year 2025. However, in February there was no massive wave of revelations as after the dot-com bubble. This is normal. As I wrote above, the fraud is usually revealed only after the burst.
The job market and the interest rates
The tenth point was the job market, which was softening with mixed signals. In January 2026, the U.S. added 130,000 jobs and the unemployment rate fell to 4.3% from 4.4%. However, there were major downward revisions: 862,000 fewer jobs in the previous twelve months than first reported, and only 181,000 jobs added in the whole year of 2025. The announced layoffs in January were more than 108,000, the highest since 2009. The number of open jobs in the U.S. fell by nearly one million in 2025, and the private sector added only 22,000 jobs in January according to ADP, less than half of what analysts expected. Historically, a labor market this weak occurred before the crises of 2001 and 2008.
The eleventh point was the interest rates. In February, the Fed funds target rate was 3.50% to 3.75%, with an effective rate of around 3.64%, unchanged at the January meeting after the cuts in 2025. This was the lowest level since 2022, but still relatively high. The market expected more cuts, partly because of a new chair of the Federal Reserve and the pressure from President Trump, and lower rates would have been good news for technology investors, because they increase the confidence in technology stocks and make borrowing easier for companies. As I will show in Chapter VI, this was the assumption in my analysis which turned out to be the most wrong.
The CEOs
The twelfth point was the populism of the CEOs. The leaders of AI had become celebrities, comparable to the “rock stars” of the dot-com era. Their interviews were followed by millions of people and their statements moved markets. CEOs such as Jensen Huang of Nvidia are currently seen as “Gods” in technology and innovation. Moreover, the conferences of Nvidia have become similar to the concerts of Taylor Swift in their size and in the support of their fans, the investors.
Expectations and reality
Beyond the checklist, I looked at what AI was actually delivering. The expectations were enormous. The “Superagency” framework of McKinsey from January 2025 projected up to $4.4 trillion of annual productivity gains for companies by 2030, with AI potentially automating three hours of daily work and acting as a “thought partner.” BCG showed that the most advanced companies in AI delivered around four times higher total shareholder returns than the laggards, and Goldman Sachs estimated that generative AI could lift global GDP by 7% over a decade.
However, the adoption data were much more modest. According to McKinsey, only 1% of companies were “AI-mature”, and while 78% used AI in at least one function, most of them were still in a pilot mode. BCG noted that the adoption among frontline employees had stalled at 51%, and Deloitte highlighted that 70% of the value creation depends on the redesign of the workforce and not on the technology alone. In practice, many companies reported modest or no measurable return: 36% of organizations saw no change in revenue from AI in surveys from 2025, and only 19% achieved more than 5% of extra revenue.
Furthermore, the progress of the models themselves seemed to slow down. The capabilities advanced dramatically between 2022 and 2024, with huge leaps in reasoning, multimodality and benchmark scores. Since late 2025, however, the pace of improvement had slowed noticeably. The gains were coming more from techniques at the time of use, from tools and from post-training, and less from simply adding more compute and data. New releases, such as GPT-5.2 and Gemini 3 in February 2026, were judged more on whether they delivered a return than on how impressive they were.
Electricity, commodities and crypto
There were also other signals. Electricity was emerging as one of the most binding limits of the build-out. The demand of data centers was projected to consume 6% to 12% of all U.S. electricity by 2028, up from around 4.4% in 2023, with some forecasts showing a 31-fold surge in the load from AI. The queues to connect to the grid stretched for seven years and more in key regions, which forced delays, gas generation on site and even restarts of nuclear plants. And there was the risk of the supply chain: Taiwan had rejected the idea of moving 40% of the production of TSMC to the U.S., which showed how much the whole AI industry depends on one island.
In the other markets, the tension was clearly visible. Gold and silver had reached extreme valuations in late 2025 and early 2026 on the flows into safe havens and on speculation, and then experienced sharp corrections, with hundreds of billions of dollars of market value wiped out in single sessions. Bitcoin and the broader crypto market had lost more than 45% from their peaks in 2025, with bitcoin trading around $60,000 to $66,000 in the middle of February. In the stock market, the multi-year rally had paused. The memory companies, such as Sandisk and Micron, had gained more than 200% in 2025 on the demand for AI memory and storage, but then stagnated, and most of the technology stocks were 15% or more below their highs. Microsoft, Meta, Apple, AMD, Palantir, Robinhood and Oracle were significantly below their highs, while Nvidia, JPMorgan, Alphabet and Tesla were moving sideways. One portfolio manager said that “it makes you worry about what other pockets have been driven up by almost pure speculation.”
The worriedness paradox
The last point was the sentiment, and it was perhaps the most interesting one. The sentiment had been incredibly positive throughout 2025, driven by consistent beats of earnings, announcements of spending and the narrative that “AI is inevitable.” The first notable shift came in November 2025. After that, the market split: the companies at the core of the infrastructure continued to rise on strong guidance, while the broader AI ecosystem, software and smaller companies, stagnated or corrected despite good results.
At the same time, the amount of public commentary about an “AI bubble” had declined since late 2025. And the most respected voices largely said that there was no bubble, or at least not yet. Owen Lamont, a fund manager and scholar of bubbles, had written about “a trillion reasons” why we were not in one, arguing that if we were, insiders would bring hundreds of companies public to sell to naive investors infatuated with AI. Peter Oppenheimer, the chief global equity strategist of Goldman Sachs, argued that we were not in a bubble “yet”, because the companies investing in AI were profitable and rich in cash, in contrast to many companies in the tech and telecom boom. The Wall Street Journal wrote that “signs of a major bubble top” were not here quite yet, while also noting: “Some say if everyone is talking about a bubble, it’s a sign there isn’t one. Yet bubble arguments raged in 1999 even as it continued to inflate.”
The consensus among sophisticated voices that there was no bubble was itself a data point worth monitoring. In the dot-com bubble, the most respected people also explained why this time was different.
My conclusion in February
Taking all these points together, my conclusion in February 2026 was that the market was in a “prove it” phase. If the upcoming quarterly earnings failed to exceed the already high expectations on both revenue and the monetization of AI, a significant decline of 15% to 30% or more in the riskiest stocks was probable. At the same time, every new announcement of more AI spending was now met with immediate selling, the exact opposite of 2025. However, a genuine breakthrough in innovation, for example a new model from Anthropic or OpenAI, or an unexpected win in productivity for companies, could quickly turn the sentiment back to euphoria, which shows how binary and driven by narrative the pricing of AI was.
My final verdict was the following: the real demand and the profitable leaders differentiate this boom from the dot-com bubble, which lowers the risk of a burst or significant decline, but the bubble-like traits, the concentration, the intensity of the spending and the euphoria, support caution.
Chapter III
From War to Mania: The Great Chip Melt-Up
The “prove it” phase did not end in a crash. A crash in software, a war with Iran and a ceasefire later, it ended in the most violent melt-up of semiconductor stocks since the final weeks before March 2000. The bubble did not pop; it rotated and accelerated. Every velocity record of the spring of 2026 has its twin in the last weeks of the dot-com bubble.
When speculative small stocks win big, often it’s because investors aren’t thinking straight.
James Mackintosh, The Wall Street Journal (5 June 2026)
A market which rises on good news is normal. A market which rises through every piece of bad news, faster and faster, is a mania.
The SaaSpocalypse
The first shock of 2026 came not from outside the AI world, but from inside of it. In January and February, around $1.6 trillion was wiped from the market value of software stocks, as investors feared that the coding tools of Anthropic and OpenAI, the so-called “vibe coding”, would destroy the business models of software companies. The market called it the “SaaSpocalypse.” Companies of the type of Salesforce and ServiceNow plunged, and the fear spread to insurance, asset management and even trucking: when a company which was once a maker of karaoke machines started to promote its AI tools, it sank the stocks of transport companies. The dispersion between single stocks became the widest since at least 1994.
The Wall Street Journal described the behavior of the investors very precisely: they were “selling first and asking questions later”, even though there was little evidence that AI was actually damaging the earnings of these companies yet (WSJ, 3 March 2026). This was an important moment for my analysis, because it showed that AI had become a two-sided factor in the market. On one side, it inflated the stocks of chips and infrastructure. On the other side, it deflated the stocks of software and services. Both sides were driven by the same narrative, that AI will change everything very fast. If the narrative was right, the software companies were in danger. If the narrative was wrong, the chip companies were overvalued. In both cases, the market was pricing a future which had not happened yet.
The deals continue
While software was crashing, the circle of AI deals widened. On 24 February, Meta and AMD announced an AI-chips deal worth more than $100 billion, which could leave Meta owning up to 10% of AMD, as the chip maker tried to challenge Nvidia. With this deal, a new variant of circular financing appeared: the customer and the supplier now held each other’s equity. On 2 March, Nvidia invested $2 billion into each of Coherent and Lumentum, two makers of optical interconnects, and backed Ayar Labs in a $500 million round at a $3.8 billion valuation, together with AMD. The demand side kept financing its own supply chain.
At the same time, the valuations of start-ups were being manufactured in new ways. Aaru, a company founded by teenagers in March 2024, whose AI agents simulate the answers of humans to surveys, reached a headline valuation of $1 billion through a round with multiple tiers: half of the investors priced it at $450 million, the other half at $1 billion (WSJ, 22 February and 11 March 2026). Serval jumped from a valuation below $400 million in a private deal with Sequoia to an announcement as a $1 billion “unicorn” within days, through a second tier priced higher. The company Carta counted around twenty such deals with multiple tiers in six to twelve months. “It absolutely does inflate valuations,” said AHOY Capital, and even John Chambers, the CEO of Cisco in the dot-com era, said that most venture capitalists he knows would refuse such deals. It was no longer enough for young founders to raise huge rounds. The rounds themselves were now engineered to manufacture headline valuations. This is the private-market version of the first-day jumps of the dot-com IPOs.
The war
In late February, the United States and Israel attacked Iran. The war triggered a classic risk-off move. The Magnificent Seven fell by around 16% in the first three months of the year, as the largest and most liquid stocks were sold first. The price of oil spiked, with Brent trading near $100 to $110 per barrel, and the consumer sentiment collapsed towards record lows as the prices of gasoline went up.
The ceasefire and the melt-up
In April, a ceasefire together with blowout earnings of the chip companies in the first quarter turned the market around completely. The semiconductor stocks rose by 38% in April alone, which was their best monthly return since February 2000. On 30 April, Alphabet gained $421 billion of market value in a single day, the second-largest one-day gain in history. Part of the fuel was a new agentic model of Anthropic, which had “wowed” customers around the New Year and resurrected the demand for CPUs and memory, so the worries about the slowing progress of the models from late 2025 were, at least temporarily, refuted.
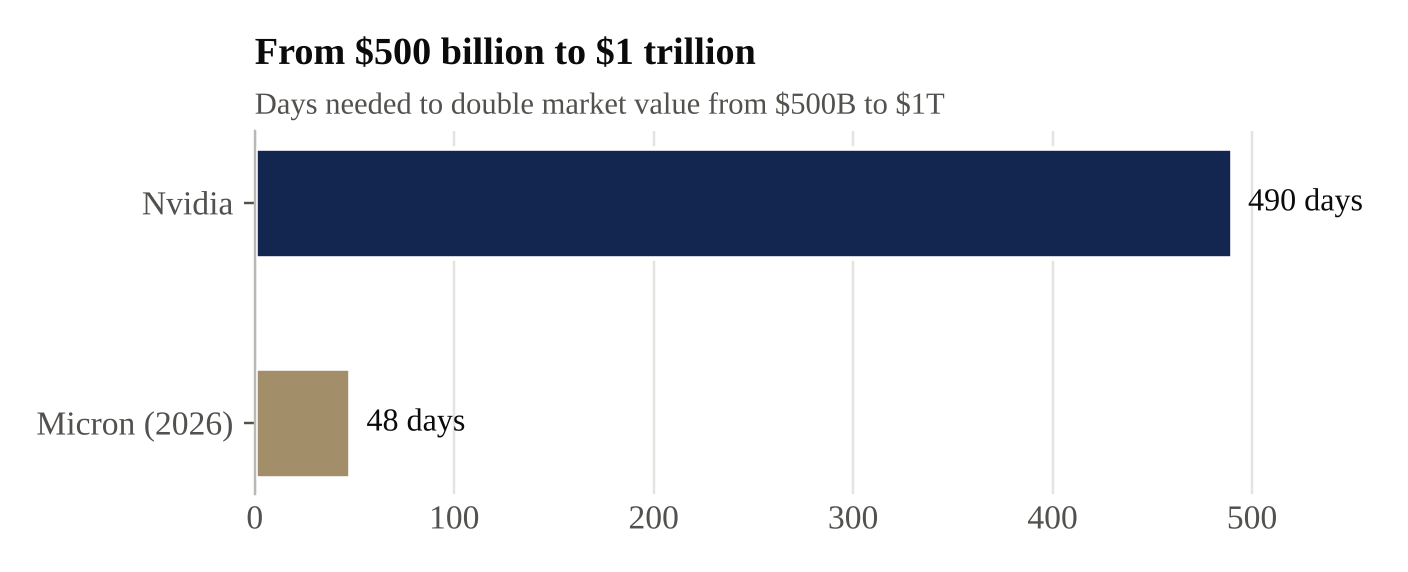
In May, the melt-up became historic. Micron doubled its market value from $500 billion to $1 trillion in only 48 days, the fastest run of this size ever; Nvidia had needed 490 days for the same step. The PHLX Semiconductor Index posted its best 25-day run, +54%, since March 2000, and its best first 100 trading days of a year ever, +82%, with the previous record from 1995. The semiconductor stocks of the S&P 500 added around $5.7 trillion of market value in six weeks.
The single stocks moved in a way seen before only in the charts of 1999 and 2000. Intel rose by 239% in 2026 and then more than tripled, reaching its first record in 26 years: it was losing to Nvidia in GPUs and to TSMC in manufacturing, and the rally was driven by a halo of CPUs for agentic AI. Sandisk rose by 570% in 2026 and by 915% in one year. Qualcomm rose by around 1,200% in one year and Nvidia by 390%. UBS tripled its price target for Micron to $1,625 from $535, as Micron was forecast to make around $107 billion of revenue and around $77 billion of operating profit in this fiscal year, compared with an operating loss in 2023. Samsung, SK Hynix and Micron all joined the club of companies worth $1 trillion, AMD became worth more than JPMorgan, and the Korean Kospi index rose by 78% in 2026.
According to BTIG, the ten best-performing stocks of the Nasdaq had risen by 784%, compared with 622% at the peak in March 2000. Even the names rhyme, because Qualcomm, Nvidia, Micron, Sandisk and MicroStrategy (today called Strategy) were names of the dot-com era as well.
Two markets in one
Under the surface of the record indexes, the market was extremely divided. The S&P 500 traded in a range of only 2.7%, while the average stock in the index moved in a band around seven times wider, the largest divergence since at least 1994 (Barclays). Microsoft was down 18% in 2026, a loss of more than $500 billion of market value, and Intuit was down 37%, while Texas Pacific Land was up 85% and Sandisk had tripled. “Dispersion is a signature of periods of high innovation,” said Barclays’ Pascale. That is true, and it also preceded the dot-com bust.
The most absurd part of the melt-up, and the clearest rhyme with 1999, was the companies outside of AI which suddenly became “AI stocks”. The stock of Ford surged to a three-year high after it announced “Ford Energy”, a subsidiary for power connected with AI. A Japanese maker of toilets and a glass company became “AI stocks.” Several companies quintupled their value only by announcing a pivot to AI. The maker of shoes Allbirds turned into “NewBird AI” and then into “Smartbird”, and its stock spiked on the pivot. This is the trade of 1999, when companies added “.com” to their names and their stocks jumped. In the dot-com bubble, it was the name. In 2026, it was the press release or “.AI”.
The retail investors
The retail investors joined the melt-up with leverage. At Interactive Brokers, the ten most traded tickers consisted almost entirely of chip makers, their customers and SOXL, an ETF which offers three times the daily return of the semiconductor index and which had risen by around 1,200% in one year. Thrill-seekers were posting screenshots of their gains on Reddit and X. Penny stocks rose by 28% after 30 March, and the Russell Microcap index was up 21% in 2026, while the Magnificent Seven were up only 6%. As Mackintosh from WSJ wrote, “when speculative small stocks win big, often it’s because investors aren’t thinking straight.” Bloom Energy rose by 235% in 2026 and fourteen times in twelve months, and it was about to jump directly from an index of small companies into an index of the largest companies, for the first time since at least 2008.
There was one important counterpoint. Jason Zweig and Owen Lamont noted that the retail investors were mostly buying the dips, on news of war, tariffs or inflation, which is contrarian behavior and not the classic chasing of performance. “A bubble is buy the rip, not buy the dip.” In July, this was a fair argument that the top was not yet in. However, as I will show in Chapter VII, by the autumn the leverage in the hands of retail investors had increased so much that the next dip could turn into forced selling.
The flood of issuance
One of the best descriptions of a bubble is the framework of Owen Lamont, who described the “four horsemen” of a bubble: high prices, high volatility and volume, bubble beliefs spreading, and a tidal wave of issuance. In February, three of them were present, but the issuance was missing. This was the main reason why Lamont did not believe in a bubble at the end of 2025: if we were in a bubble, insiders would bring hundreds of companies to the stock market to sell their shares to naive investors. “Issuance is the thing I’m keeping my eye on,” he said.
In June 2026, the fourth horseman arrived. SpaceX launched its IPO, which raised a record $75 billion, and a few days later used its freshly listed and expensive stock to buy Cursor for $60 billion in an all-stock deal. Mackintosh noted that Elon Musk was using new stock to buy an AI asset which his chatbot Grok could not build on its own. Two-thirds of the mergers and acquisitions in the dot-com era were financed with stock; in this quarter of 2026, it was around half of the deal value (LSEG). Cerebras raised $5.55 billion and its stock doubled on its debut. Anthropic filed confidential IPO paperwork at a valuation of around $1 trillion, and OpenAI was expected to file soon. Both labs had raised more than $100 billion of venture funding each.
The most historic issuance, however, came from the richest company on Earth. Alphabet announced that it would sell $85 billion of new shares, including $10 billion to Berkshire Hathaway, and upsized the deal by $5 billion because of the demand. Its shares fell by 3.9% on the announcement and lost around $340 billion of market value in three sessions, the largest three-day loss on record. “The fact that they had to raise equity really makes you wonder about the intensity of the capex needs,” said MoffettNathanson. It recalls the logic of Benjamin Graham and “Mr. Market”: companies sell their shares when they consider them expensive. A company which always financed itself with its own cash, and then with debt, now sold stock. This was one of the most important signals of the year.
At the same time, there was a strong counter-signal in the same deal. Berkshire Hathaway, the company of Warren Buffett, bought $10 billion of the new Alphabet shares. The house of Buffett buying into a raise is not what the top of a bubble usually looks like. It remains one of the strongest counterarguments to the bubble thesis.
The capex is bought again
In June, Samsung and SK Hynix announced a plan for a chip hub worth more than $500 billion. In February, an announcement like this would have been sold. In June, it was bought the next day. The reflexive buying of spending news, which had stopped in February, was back.
However, the market had started to differentiate at the level of single companies. Oracle reported spending of $55.7 billion in its fiscal year 2026, around $5 billion above estimates, guided net spending of around $70 billion for the fiscal year 2027, and flagged pressure on its margins. Its stock fell by as much as 12% on the report, despite 47% growth of its cloud business. Tesla fell by 4% on a spending target of $25 billion. Companies which raised their spending without matching revenue were punished, while the sector as a whole was rewarded. The spending was now rewarded only on condition.
The numbers behind the euphoria
The numbers behind the melt-up were impressive, and they deserve to be presented fairly, because they are the main reason why the bubble could inflate further. The four largest hyperscalers were now expected to spend around $674 billion in 2026, more than double the level of two years before (WSJ, 27 April 2026). Morgan Stanley projected the five largest hyperscalers to spend more than $800 billion in 2026 and $1.1 trillion in 2027, which is 3.3% of the U.S. GDP, more than the projected spending on national defense, and a larger share of the economy than the expansion of the railroads in the 1850s.
The profits followed. The profits of the Magnificent Seven rose by 61% in the first quarter, compared with 16% for the other 493 companies of the S&P 500, which were themselves inflated by the chip companies. Micron traded at only around 9 to 10 times its forward earnings, while it was forecast to earn around $100 billion over twelve months, more than Meta or Berkshire. The semiconductor index traded at around 26 times its forward earnings, compared with a ten-year average of 21 times and far below the 100 to 200 times of the dot-com era. The S&P 500 traded at a forward P/E just below 20, compared with the record of 24.5 in the dot-com bubble (WSJ, Mackintosh, 21 June 2026). The biggest winners of the dot-com bubble had little or no earnings. The biggest winners of 2026 had the biggest earnings in corporate history.
The demand also still exceeded the supply. The memory market was in the biggest supply crunch in more than 40 years. The hourly cost of renting an Nvidia B200 chip nearly doubled in three months, from $2.66 to $5.27, and the spot price of DDR5 memory doubled after November (Ornn data). Anthropic reached its first profitable quarter, with revenue doubling to around $10.9 billion in the second quarter and an annualized run-rate of around $50 billion, compared with $9 billion at the end of 2025. Dot-com never produced such a proof of monetization at scale before its crash.
But the economy underneath
Behind these numbers, the economy looked very different. Estimates suggest that “AI economy” grew by around 31% in the first quarter, while the rest of the economy grew by only 0.1%. The gross spending on computers added 1.7 percentage points to the GDP growth of 2.0% in the first quarter, but after subtracting imports, only 0.4 percentage points. The share of labor in business output fell to 54.1%, the lowest since the records began in 1947.
The consumer sentiment of the University of Michigan fell to the lowest level in its 70 years of surveys, even below June 2022, as the war pushed up the prices of gasoline. At the same time, the Shiller CAPE reached 40.8. The only other time it was above 40 in its long history was around the peak in 2000, and at that time the consumer sentiment was at record highs. As The Wall Street Journal wrote, “The stock market on the moon and households in increasing gloom are reflecting on the same thing” (WSJ, 23 May 2026): the margins from AI for companies, and the fear of AI among workers.
There were also signs that the physical world could not keep up with the money. JPMorgan found that more than 60% of the data-center capacity planned for completion in 2027 was not yet under construction, and another 7% was delayed. The capital was being raised faster than it could physically be deployed.
The first warning lights
At the end of June and the beginning of July, the first warning lights started to flash. The sentiment indicator of Wells Fargo triggered a sell signal for the first time since November 2021, which Ohsung Kwon described as a “sugar high.” Drew Pettit of Citi said on 2 July that it was “time to take some gains off the table.” The semiconductor index was far above both its 50-day and its 200-day moving averages.
The bigger warning came from the Federal Reserve. On 17 June, the Fed held its rate at 3.50% to 3.75% for the fourth meeting in a row, at the first meeting under the new chair, Kevin Warsh. Warsh had been expected to lean dovish, and my February assumptions had counted on stronger cuts under a new chair. Instead, the projections of the Fed were a hawkish shock: 9 of 19 officials projected at least one hike in 2026, and 6 of them projected two or more. The forecast for inflation measured by the PCE in 2026 was raised sharply to 3.6% from 2.7%, because of the energy costs from the war. The futures markets started to price the rate rising towards around 3.8% by October and around 4% by the end of the year. At the beginning of July, the payrolls for June came in at only +57,000 jobs, compared with around 110,000 expected, with an unemployment rate of 4.2%.
On 1 July, the Dow Jones jumped by around 600 points to a record, while the Nasdaq fell as the chip stocks sold off. The chip stocks were now around 10% to 12% below their highs of 22 June. Small companies and defensive stocks were leading while the semiconductors wobbled. It was the first crack in the melt-up.
The smart AI bull hedges
At the same time, the most surprising news of the summer appeared. The fund of Leopold Aschenbrenner, Situational Awareness, which was famous as the most concentrated AI bull in the market, disclosed in its filing for the first quarter (13F, filed 18 May) that it held around $8.5 billion of notional put options across the chip sector, with puts on a semiconductor ETF as its single largest reported position, followed by puts on Nvidia, Oracle, Broadcom, AMD, Micron, TSMC and Intel. At the same time, it stayed heavily long on the infrastructure layer: Bloom Energy was its largest long position, together with Sandisk, CoreWeave and miners of crypto and operators of data centers such as IREN and Applied Digital. His logic was that electrons, not algorithms, are the bottleneck, and that once the build-out matures, the chip makers will face competition which destroys their margins.
A few weeks later, in July, the same fund was liquidated because of its leverage. Chapter VI comes back to this.
My verdict in July
By July 2026, my verdict was the following. The bubble did not pop in the first quarter. It rotated and re-accelerated into semiconductors, which is the purest signature of a late-cycle melt-up. The “prove it” phase of February was resolved bullishly: the earnings beat, and the market embraced the spending again. The bubble broadened from the Magnificent Seven into the entire stack of chips, and even into companies outside of AI which only announced a pivot. That is exactly how 1999 behaved after its own scare in the autumn of 1998, around the collapse of Long-Term Capital Management.
The counterweight was that this melt-up was uniquely backed by earnings. The setup in July was extreme speed, a flood of issuance and a hawkish surprise from the Fed, against profits which were genuinely exploding. Manias peak on good news, with a bang and not a whimper, and the good news of the spring, the blowout earnings of the chip companies, was what powered this leg of the bubble. In February, the calm at the level of the index had masked what was coming. In July, the euphoria at the level of the index was masking something else: the financing.
Chapter IV
The Money Behind the Machine
In the dot-com bubble, the cash burn was at the start-ups. Today, it is at the giants. The AI build-out is larger than the railroads relative to the economy, and it is now paid for with bonds, new shares, leases and promises which do not appear on the balance sheets. At every level, the vendors finance their own customers. Revenue across the system is increasingly the same dollars going around.
Estimates of $7 trillion to be spent on data centers in the next four years are enough to seriously damage the economy if productivity gains aren’t big enough to justify it. And the increasing use of debt financing means that if AI more broadly turns out to be a bubble, it could hit the financial system, too.
James Mackintosh, The Wall Street Journal (1 August 2026)
When people talk about the AI bubble, they usually talk about the stock prices. The stock prices are only the surface. The real story of 2026 is the money behind the machine: how much is being spent, who is paying for it, where is the money coming from and with what kind of money. In February, the answer was still mostly “with their own cash.” By October, the answer was “with everybody else’s money.” This chapter describes how the financing of the AI boom changed during 2026, because this is where the bust is most likely to come from.
The biggest bet in history
The numbers of the spending changed so many times during the year that it is easy to lose the perspective. In February, the four largest tech companies planned to spend up to $670 billion in 2026, which was supposed to be around one third more than in 2025. In April, the expectation for the same four companies was around $674 billion, more than double the level of two years earlier. In May, Morgan Stanley projected more than $800 billion for the five largest hyperscalers in 2026 and $1.1 trillion in 2027. And in September, the consensus for the five large hyperscalers, Alphabet, Amazon, Meta, Microsoft and Oracle, was around $430 billion in 2025, around $790 billion in 2026, around $1.07 trillion in 2027 and around $1.16 trillion in 2028 (WSJ, 23 September 2026).
The single quarters show the speed. Alphabet alone spent $51.4 billion on capital expenditures in the third quarter of 2026, compared with $24.0 billion a year earlier. It kept its plan for 2026 at $195 to $205 billion and said that its spending in 2027 will “increase significantly.” Microsoft spent $45.2 billion in one quarter, including finance leases (company reports, 28 October 2026). In February, my note said that the spending in 2026 would be one third higher than in 2025. By the autumn, the spending was on a path to roughly double the level of 2025 by 2027.
The best way to understand the size of this spending is to compare it with history. Stijn Van Nieuwerburgh of Columbia University calculated the average annual spending on the great infrastructure booms of the U.S. as a share of GDP. The canals took around 0.66% of GDP per year, the railroads 2.24%, electrification 0.5%, the highways 1.13%, and the telecom and fiber build-out of the dot-com era 1.1%. The AI build-out between 2025 and 2032 is projected at 3.63% of GDP per year (Van Nieuwerburgh, Columbia and Brookings). The total U.S. investment in data centers and AI infrastructure is projected at $10.3 trillion for 2025 to 2032.
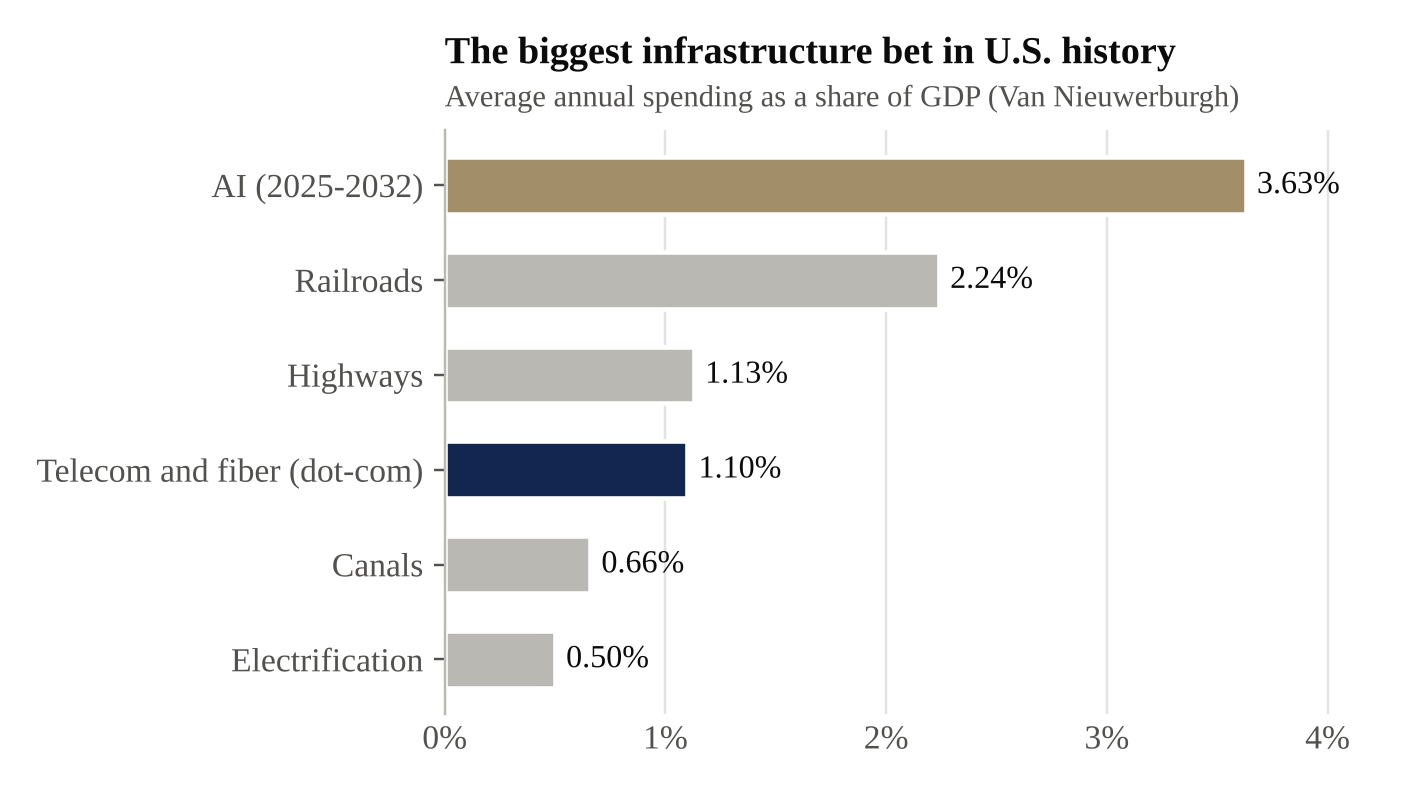
This chart is one of the most important pictures of the whole AI boom. The dot-com bubble, which ended with a crash of 78% in the Nasdaq, was built on an infrastructure boom of around 1.1% of GDP. The AI boom is around three times bigger. It is bigger than the railroads, which were the largest investment boom of the 19th century and which ended in several crashes. The Wall Street Journal called it “the biggest economic bet in U.S. history”, with spending of around 3.6% of GDP per year.
A bet of this size changes the economy around it. It strains the supply of labor and electricity, drives up the costs of land, and crowds out other industries. In 2026, the construction of data centers kept rising, while all other private construction fell. This is what crowding out looks like in the data: the money, the workers and the materials go to the data centers, and the rest of the economy gets less.
Money faster than concrete
There is also a physical problem. In June, JPMorgan found that more than 60% of the data-center capacity which was planned to be completed in 2027 was not yet under construction, and another 7% was delayed. The delays of gas turbines and transformers made it worse. In other words, the capital was being raised faster than it could physically be deployed. The spending commitments were running ahead of reality.
The hardest limit is electricity. In my February analysis, I used projections that data centers could consume 6% to 12% of U.S. electricity by 2028. During 2026, EPRI projected that data centers could consume up to 17% of U.S. electricity by 2030, from around 4% to 5% today, and that in Virginia alone they could reach 57% of the load of the state. A new risk for the grid also appeared: data centers unplugging at once. In two incidents in Virginia, around 70 facilities in July 2024 and around 40 in February 2025, which is equal to the demand of more than a million homes, data centers simultaneously switched to backup power after faults on the lines, and the grid operator PJM had to take emergency action. The Texas grid operator Ercot estimates that losing more than around 2,600 megawatts at once risks a failure of the system. As a former chairman of the federal energy regulator said, “The system is now at risk of being crashed from the load side”.
The companies are trying to solve this in their own ways. Google became the only big tech company to own a power company, Intersect, for $4.75 billion, and signed deals to reduce its demand when the grid is stressed, while Microsoft is progressing with the restart of Three Mile Island. The procurement of power has become a core strategy and no longer a detail. However, this cuts both ways for my thesis. On one side, the lack of power delays the revenue which should justify the valuations, which is bearish. On the other side, it throttles the supply of compute, which keeps the rental prices of chips high and therefore supports the profits of the chip makers in the short term, which is bullish. Simply said, capital is abundant, electrons are not.
The circle closes
In the previous chapters, I described the circular deals of February and the spring: the $300 billion contract between OpenAI and Oracle, the stake of Microsoft in OpenAI, the partnership between Nvidia and OpenAI, the deal between Meta and AMD with the option for Meta to own up to 10% of AMD, and the investments of Nvidia in its own suppliers. In the summer and autumn of 2026, the circle closed at every level.
On 27 August, Nvidia was in talks to finance the purchase of chips by OpenAI, provided $30 billion of equity funding to OpenAI and $1.5 billion of equity to SB Energy, and backstopped $105 billion for the first phase of a data-center campus of OpenAI and SB Energy in Ohio. In this structure, OpenAI signs the lease, SB Energy builds the data center, and the GPUs of Nvidia go inside. Nvidia, in the words of The Wall Street Journal, “insists it can keep printing money to fund the AI boom”.
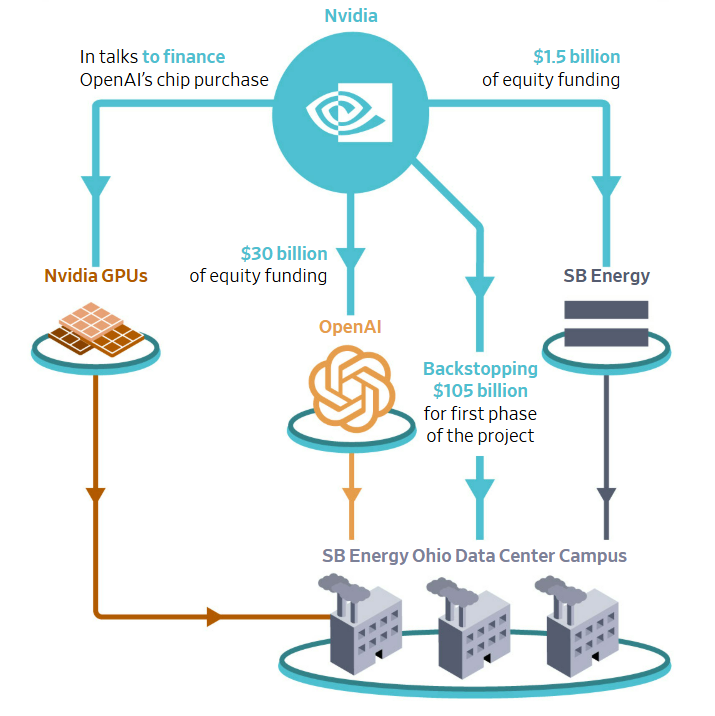
Three days later, the WSJ reported that SB Energy had issued warrants to OpenAI worth an estimated $5.5 billion, simply to win it as a tenant, and that the draft IPO papers of SB Energy warn that it is “substantially dependent on OpenAI”. The landlord pays the tenant to move in.
And on 26 October, Anthropic closed a $63 billion debt package for its compute, the biggest financing of AI infrastructure ever, which was sealed with the direct help of the CEO of Broadcom, whose company sells Anthropic the chips.
Put together, these deals form the following picture. The chip vendor funds the customer (OpenAI), funds the landlord (SB Energy) and guarantees the debt of the project. The landlord pays the tenant in warrants. The chip vendor helps its other customer borrow $63 billion in order to buy its chips. In the ecosystem as a whole, the revenue is increasingly the same dollars going around. And if OpenAI or Anthropic stumbles, Nvidia, Broadcom, Oracle, SB Energy, CoreWeave and the hyperscalers all lose the same customer at the same time.
This is the most dangerous part of the circle. In a normal economy, when one customer fails, the supplier loses one customer. In a circular economy, when one customer fails, every company in the circle loses its revenue, its investment and its collateral at once. The same structure which flatters the revenue of everybody at the same time in the boom would deflate the revenue of everybody at the same time in the downturn.
The architects of the circle
This point is an important part of why this cycle could end badly. The executives who design these circular deals, together with the investors and the politicians who enable them, are not naive. They are among the most intelligent and best-informed people in the world. They understand very well that financing your own customers, who then buy your own product, is not a sustainable business model and is likely to end in a bust.
“The situation is not that bad, It could have been my money.”
Arguably, the structure is, simply said, close to fraud in its spirit, even if every single deal is legal and properly disclosed. It creates revenue which looks organic but is partly financed by the seller itself, and it moves the risk from the people who design it to the people who buy the stocks and bonds at the end of the chain. The architects of this cycle can be relatively indifferent to the consequences, because their own wealth is already secured. If the bubble bursts, the losses will fall, as always, on the retail investors and the middle class, who will also be blamed for it, while those who designed it walk away largely untouched.
The day the cash flow turned negative
On 23 July 2026, around $890 billion was wiped from the market value of the Magnificent Seven in one day, on fears about “runaway AI spending.” The reason was that Alphabet and Tesla reported negative free cash flow despite soaring revenue, and the analysts expected Meta and Amazon to follow. For Alphabet, it was the first negative quarter in the data, going back to 2004. Microsoft was the only major AI spender with a positive free cash flow.
In the third quarter, the situation became worse. The free cash flow of Alphabet was minus $9.1 billion, compared with minus $5.9 billion in the second quarter, and its stock fell by 10% after hours when it reported at the end of October, while it warned that its spending in 2027 will “increase significantly.” Microsoft still had a positive free cash flow of $18.6 billion, but it was 27% lower than a year before (company reports and CNBC, 28 to 29 October 2026).
This was not a sudden change. Already in the spring, Amazon was expected to actually burn cash in 2026, and the spending of Meta was expected to exceed half of its annual revenue. The ratio of debt to equity of Meta reached 39%, compared with only 8% five years earlier.
Negative free cash flow means something very simple. The companies are spending more money than their businesses produce. The difference has to come from somewhere, and if it does not come from the cash flow, it has to come from outside: from bonds, from new shares, from leases and from partners. The spending of the hyperscalers, which in February was “funded mostly by internal cash”, now depends on the capital markets being open. In my February analysis, I wrote that the free cash flow of the Magnificent Seven was getting smaller, “except Nvidia.” That sentence became outdated in the worst way: the free cash flow of the hyperscalers turned negative, and the free cash flow of Nvidia halved.
Three trillion dollars that are not there
One of the most important discoveries of the year was published by The Wall Street Journal on 16 August 2026, under the title “Why Big Tech’s AI spending is $3 trillion higher than it seems” The journalists looked at the obligations of the four largest hyperscalers, Alphabet, Amazon, Meta and Microsoft. On their balance sheets, these companies carry $248 billion of lease liabilities and $356 billion of long-term debt. But off the balance sheets, they have $904 billion of leases which have not yet started, and $1.52 trillion of purchase commitments. In total, this is around $2.4 trillion of obligations which an investor does not see when looking at the balance sheet.
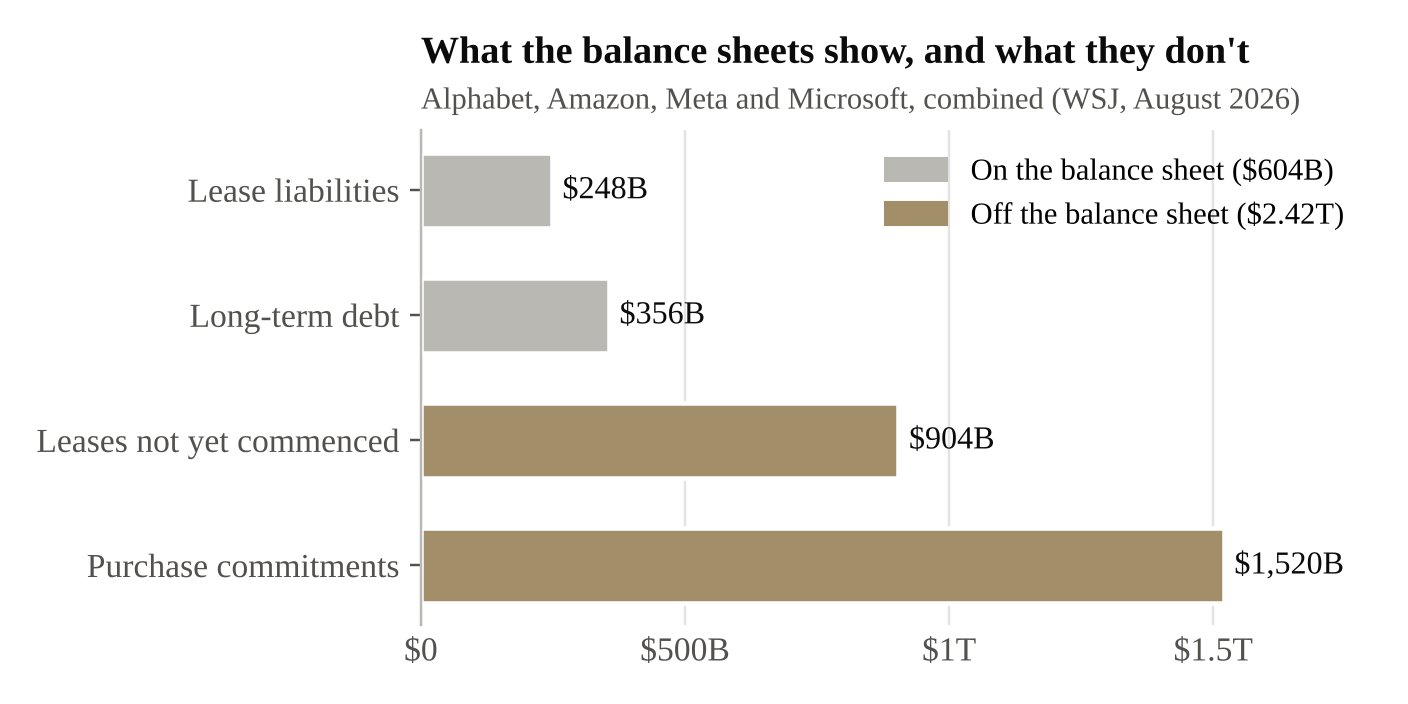
The speed of the growth is even more worrying than the size. The obligations off the balance sheet grew by around 830% in one year at Alphabet, around 760% at Meta and around 540% at Oracle, while the capital spending grew by 60% to 160%. Across nine AI companies, the leases which have not started yet total $1.2 trillion, which is around four times more than a year earlier.
The best example of how this works is Meta’s data center Hyperion. It sits in a special venture which is owned 80% by Blue Owl and 20% by Meta, and which is financed with bonds. Meta guaranteed that it would make the bondholders whole if it leaves before 20 years. However, Meta records no liability for this guarantee, because it does not consider the payment “probable.” Everything about this structure is legal. But it is exactly the type of opacity which preceded the revelations of Enron, whose special purpose entities also hid debts which were “not probable” until they suddenly were. The parallel is not that somebody is breaking the law. The parallel is that the most important numbers are not in the place where investors look.
This is also why the “P/E is reasonable” defense is weaker than it looks. Mackintosh made a very important point about this in October: the forward P/E ratios look “only” elevated because the earnings themselves are inflated by the spending. One company’s capital spending is another company’s revenue: chips, cooling, cables, generators, turbines. If the spending slows down, the earnings of the suppliers fall at the same moment as their valuations. Therefore, smoothed measures like the Shiller CAPE are the better gauge, and he called this “a parallel to 2007, when the bubble in bank stocks... was hidden by overstated book values” (WSJ, Mackintosh, 18 October 2026). The CAPE, at around 41, is at the level which only the dot-com peak exceeded.
Even Nvidia borrows
For most of the AI boom, Nvidia was the one company which did not need anybody’s money. It sold the chips, it made the profits, and it had the strongest free cash flow in the industry. In 2026, this also changed.
The free cash flow of Nvidia fell from a record of $48.55 billion in the quarter ending in April 2026 to roughly $21 to $22 billion in the quarter ending in July. At the same time, its total debt jumped from around $8.5 billion to $33.4 billion, after around $24.9 billion of new debt in the first half of its fiscal year 2027 (Nvidia 10-Q, 26 July 2026). Its supply-chain commitments rose from around $45 billion in the first quarter of its fiscal year 2026 to $279 billion in the second quarter of its fiscal year 2027, as it used its balance sheet to lock up supply. And five direct customers accounted for 70% of its receivables.
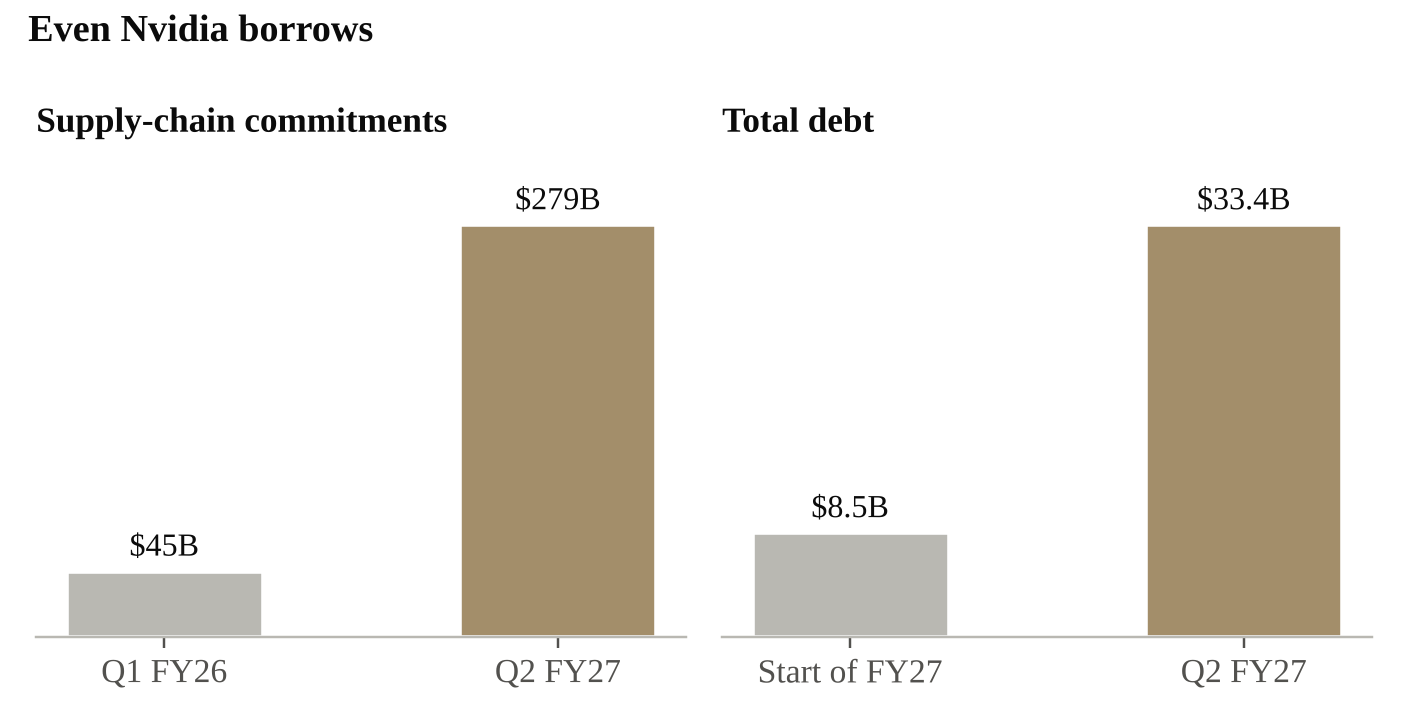
On the other side, the revenue of Nvidia was still spectacular. In the second quarter of its fiscal year 2027, it reported $96.2 billion of revenue, up 106% from a year earlier, with a gross margin of 75%, and it guided $108 billion for the next quarter. Jensen Huang said that “AI has reached its inflection point... Now, compute is revenue” (Nvidia, 26 August 2026). This is true for Nvidia. However, the question is who is paying for the compute. If a large part of the customers of Nvidia are financed by Nvidia itself, by the same five customers who are 70% of its receivables, and by debt which is backstopped by Nvidia, then the revenue of Nvidia depends on the financing of the whole circle. In dot-com, the warning sign was the cash burn at the start-ups. Today, it is the cash burn at the giants, and even the strongest giant has started to borrow.
The flood of bonds
The other side of the negative cash flow is the debt. Already in February, the increase in the issuing of bonds by technology companies was significant. By the summer, it was possible to quantify it. The five AI hyperscalers, Alphabet, Amazon, Meta, Microsoft and Oracle, had issued $159 billion of bonds globally in 2026 by early June, compared with $108 billion in the whole year of 2025 and only $17 billion in 2024. The total issuance of investment-grade bonds in the U.S. reached $632.3 billion by then, up 18% from a year earlier, the fastest start to a year on record.
The way the bonds were issued was also telling. The average number of tranches per investment-grade deal reached an all-time high of 3.3. Amazon issued $37 billion in 11 tranches with maturities until 2076, and Oracle, Salesforce, Abbott and Honeywell each split their deals into 8 to 9 tranches, including pieces with maturities of 40 years. Alphabet went global and exotic: it issued bonds in U.S. dollars, Canadian dollars, Japanese yen, euros, Swiss francs and British pounds, including a rare 100-year bond in pounds, together with $1 billion of municipal energy financing in California. When the supply of bonds has to be engineered this carefully in order to be absorbed by every pocket of demand, from insurance companies and pension funds to foreign currencies and 50-year paper, then the ability of the market to absorb more is the real constraint.
By October, the numbers had grown even further. The U.S.-dollar AI-related bond issuance reached around $420 billion in 2026 by 16 October, compared with around $220 billion in the whole of 2025. The issuers of data centers alone raised more than $100 billion, around 25% of the AI-related issuance, up from around 16% (Dealogic and Goldman Sachs; Demos, 19 October 2026). And the $63 billion debt deal of Anthropic was the biggest financing of AI infrastructure ever.
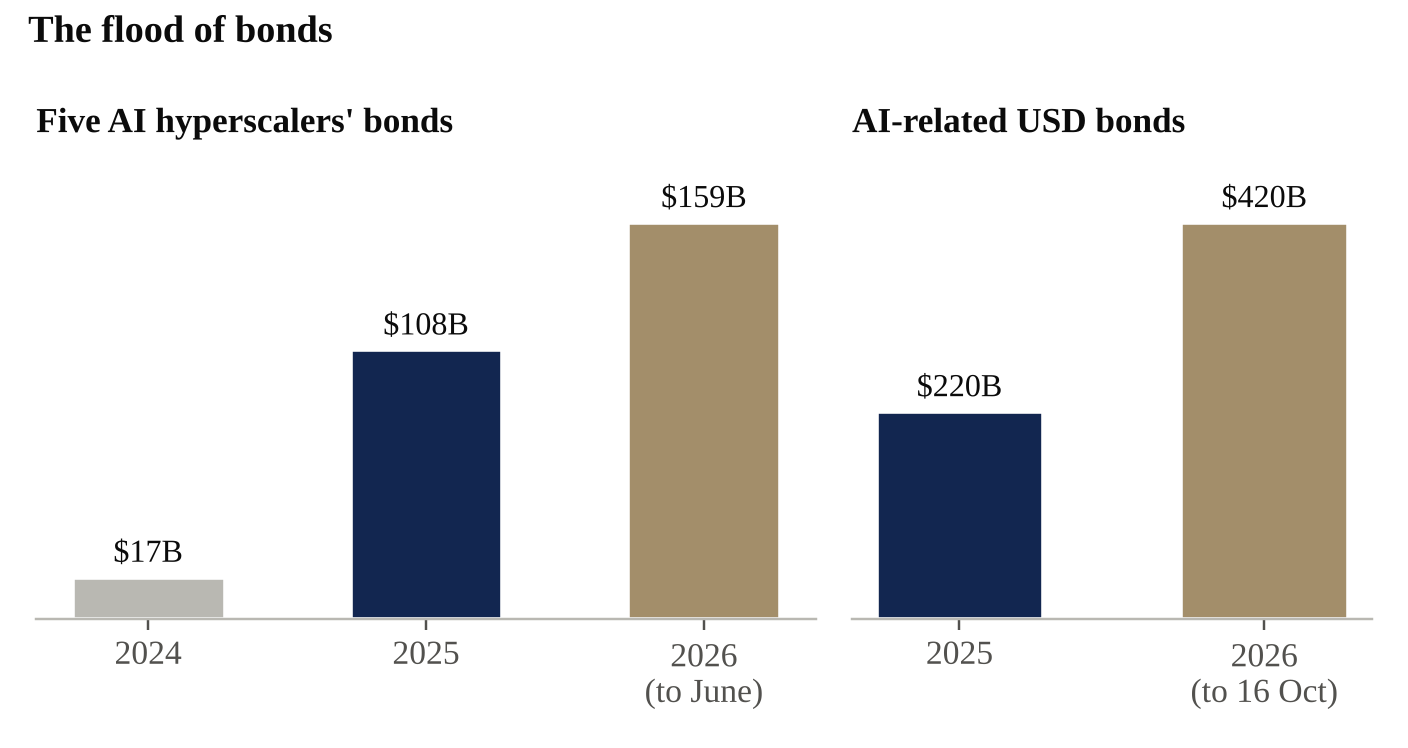
The weakest borrowers
Not every borrower is the same, and the bond market started to show it. Oracle had issued $43 billion of bonds since September 2025 and was projected to burn tens of billions of dollars over several years as it turned itself into a landlord for AI. Although its bonds were rated investment grade, they traded in line with the highest tier of speculative-grade debt, which means that the market already treated them almost as junk.
The weakest link was CoreWeave. Its unsecured bonds are rated junk, and in October its notes maturing in 2030 yielded close to 15%. Even a data-center bond for a site of Applied Digital leased to CoreWeave yielded around 8%. Pimco’s Lotfi Karoui described the new mood: “Crowding out can happen within the AI financing chain... coupled with wider spreads and higher yields, you become a little pickier.” CoreWeave returns in Chapter VIII, because it is one of the strongest candidates for the catalyst of the bust.
To be fair, the market was differentiating, not panicking. In the summer, the 10-year bonds of Alphabet, Amazon and Microsoft still traded at spreads below the average investment-grade company, which means that the market treated the credit of the core hyperscalers as pristine. Microsoft remained one of the very few companies with a AAA rating, and CoreWeave itself had tightened its spreads by around four percentage points earlier in the year and raised more than $20 billion in 2026. The strongest borrowers could still borrow cheaply. The question was how long this would last if the rates went up.
Why the build-out cannot simply stop
Some people argue that the build-out is not dangerous, because the companies can simply stop spending if the demand does not come. This is much harder than it sounds, and the structure of the financing described in this chapter is the reason.
A large part of the spending is no longer a decision which a company can change from one quarter to the next. It is written in contracts. The leases which have not yet started, $904 billion at only four hyperscalers, are commitments to pay for data centers for many years. The purchase commitments, $1.52 trillion, are promises to buy equipment. The backlog of CoreWeave, around $104 billion, is “take-or-pay”, which means that the customers have to pay even if they do not use the capacity. The guarantee of Meta for Hyperion lasts 20 years. The supply-chain commitments of Nvidia, $279 billion, were made in order to lock up the supply of its suppliers. And the bonds, around $420 billion of AI-related bonds in 2026 alone, have to be repaid whether the AI revenue arrives or not.
This means that the AI build-out has a lot of inertia. When the demand is strong, the inertia looks like strength, because the backlog grows and the revenue is visible years ahead. When the demand weakens, the same inertia becomes a weight. The companies cannot simply stop. They have to keep paying for the commitments, or they have to renegotiate them, which shows the market that the demand was weaker than expected, or they have to write them down, which hits their earnings. In the dot-com bubble, the telecom companies were in the same position with their fiber. The fiber was in the ground, the debt was on the books, and the demand did not come at the expected prices.
Insanely capital intensive
Taking everything together, the AI build-out has become insanely capital intensive. It is now around three times the dot-com telecom and fiber build-out relative to the GDP and bigger than the railroads. This is not a sustainable practice when it is increasingly financed by selling bonds and shares, which means more debt and more dilution, instead of by free cash flow.
In February, the main difference between the AI boom and the dot-com bubble was that the leaders were rich in cash and funded the spending themselves. By October, the same leaders had negative free cash flow, $2.4 trillion of obligations off their balance sheets, hundreds of billions of new bonds and, in the case of Alphabet, a sale of $85 billion of new shares. Profitable leaders still differentiate this boom from the dot-com bubble. But they are now the ones taking on the debt.
There is one more important consequence. Because the spending is now financed from outside, it depends on the price of money. As long as the rates are low and the investors are willing to buy bonds and shares, the spending can continue. When the rates go up, every dollar of the build-out becomes more expensive. In 2026, the rates went up. Before turning to how this happened, it is necessary to describe the two companies at the center of the whole circle, because in the end, almost all of this money depends on them.
Chapter V
Two Labs Carry Everything
Behind the trillion-dollar build-out stand two companies which burn cash: OpenAI and Anthropic. Around 70% of the AI revenue of the hyperscalers comes from them. In 2026, one of them became the front-runner and the other started to stumble, while both entered a price war with Chinese open-source models. To justify the build-out, AI revenue would have to reach around 9% of the U.S. GDP by 2032, about as much as Americans spend on food.
AI will almost certainly raise productivity and economic growth, but not necessarily in ways that translate directly into revenue, or the fat returns investors are counting on.
Greg Ip, The Wall Street Journal (2 October 2026)
Every circle has a center. In the AI boom, the center is two companies. Nvidia sells the chips, the hyperscalers build the data centers, Oracle and CoreWeave rent out the capacity, SB Energy builds the campuses, and the banks and the private credit funds lend the money. But a very large part of the final demand for all of this comes from OpenAI and Anthropic. If these two companies can pay, the circle works. If one of them cannot pay, the circle breaks. This concentration is arguably the single most important fragility of the AI bubble, and it is something which did not exist in the same form in the dot-com era.
The concentration
In 2026, several banks tried to estimate how much of the AI revenue of the cloud businesses comes from the two labs. Barclays estimated that around 73% of the AI revenue of Amazon Web Services in 2026 comes from OpenAI and Anthropic. UBS estimated that around 28% of the revenue of Google Cloud in 2026 comes from them, rising to 48% in 2027. Wells Fargo estimated that around 23% of the revenue of Microsoft’s Azure in its fiscal year 2026 comes from them, rising to 35% in its fiscal year 2027 (via Zitron and ChainCatcher, 5 August 2026). Together with the fact that five direct customers account for 70% of the receivables of Nvidia, this means that around 70% of the AI revenue of the hyperscalers depends on two companies which do not produce sustainable profits yet.
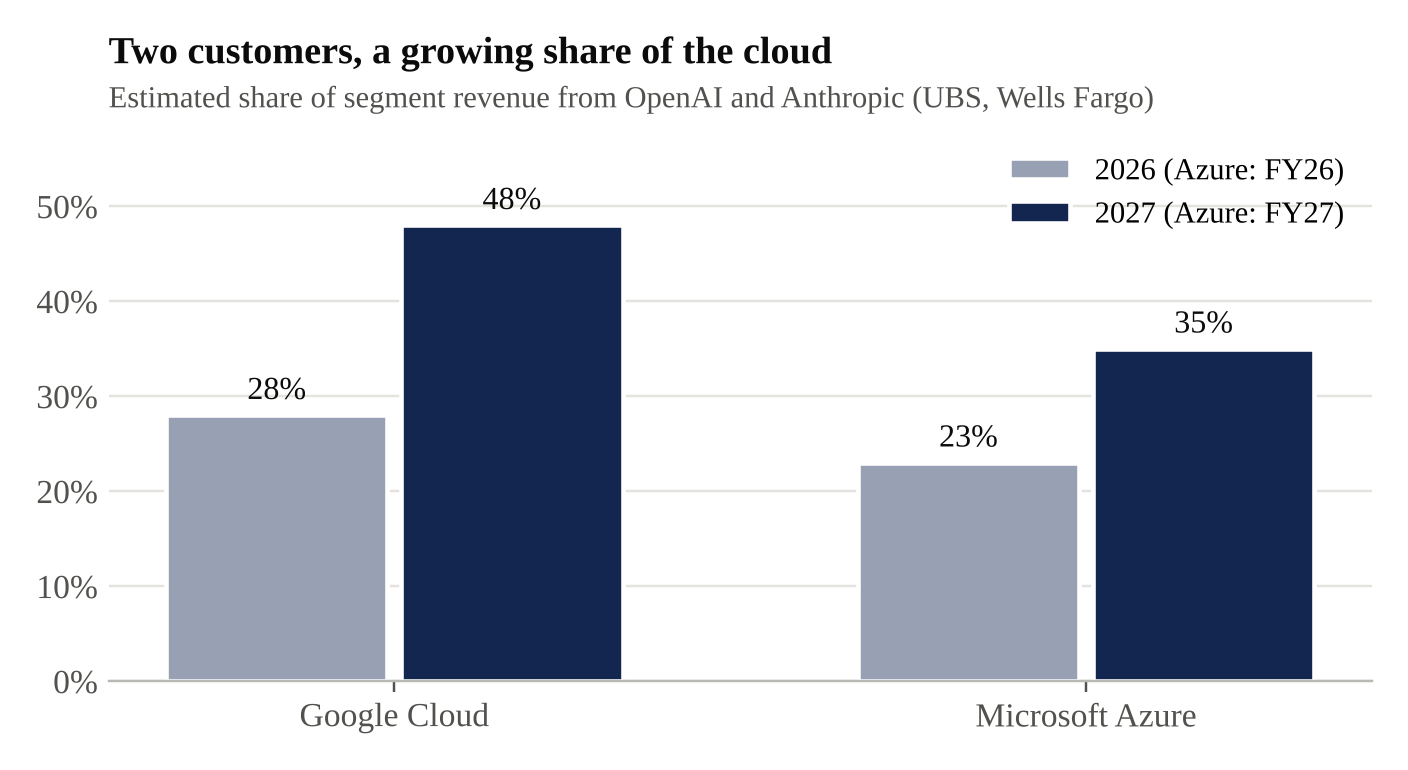
The trend in these numbers is the important part. The dependency is not getting smaller with time; it is getting bigger. In 2027, almost half of the revenue of Google Cloud is expected to come from two customers. In any normal industry, a supplier with half of its revenue coming from two customers who lose money would be considered a high risk. In the AI industry, it is considered a growth story.
OpenAI: the giant which started to stumble
At the start of my analysis, OpenAI was the flagship of the AI boom. As I described in Chapter II, it had a revenue run-rate of around $20 billion at the end of 2025, commitments of around $1.4 trillion over eight years according to Moody’s, a $300 billion contract with Oracle, deep connections with Microsoft, Nvidia and SoftBank, and a burn of around $5 to $7 billion per quarter. HSBC estimated that it needed $207 billion of new funding by 2030 only for its data centers.
In February, I compared OpenAI with Amazon in 2001. Amazon was also burning cash in the wreckage of the dot-com bubble, its shares fell by more than 80% from their peak, and yet it became a long-term giant through relentless execution. On the other side, there is BlackBerry, which was dominant early and then lost around 95% of its value when the ecosystem moved on. My conclusion was that the strong position of OpenAI in foundational models and the backing of the hyperscalers could allow it to survive, but that, as with Amazon, any unwind in the short term would still inflict severe pain on its partners.
During 2026, OpenAI moved more in the direction of the second example.
The first sign came in March, when OpenAI abruptly shut down Sora, its most hyped product since ChatGPT. The video tools consumed too many chips and were unprofitable, and the investment of $1 billion from Disney never materialized, with the relationship now dormant. OpenAI pivoted to a “superapp” with agentic tools and to long-term bets on robotics. This showed that AI is much more costly than predicted. When a company sacrifices its flagship product in order to save compute, it means that the costs are too high for the price which customers are willing to pay.
At the same time, the corporate customers started to ration AI as the costs skyrocketed. Microsoft started to offer cheaper AI options, because of the “sticker shock” of its customers, and Satya Nadella said that “we can’t let AI giants eat the economy.” For OpenAI, whose $1.4 trillion of commitments assumes an aggressive monetization, the sensitivity of the customers to the price is a direct threat to the whole math of its funding.
The second sign was the departure of its people. In 2026, around fourteen senior leaders left OpenAI, including the chief revenue officer Denise Dresser, the former chief operating officer Brad Lightcap, the CEO of applications Fidji Simo, the head of data centers Chris Malone, Kevin Weil, the lead of safety systems Johannes Heidecke and the vice president of research Barret Zoph, who went to Google DeepMind (Yahoo Finance, 27 August 2026). When the people who know the numbers best leave a company before its IPO, it is a signal which an investor should not ignore.
The third sign was the price. OpenAI cut the price of its GPT-5.6 Luna model by 80% and of its Terra model by around 20%, and Sam Altman said that he would be “happy to deliver at one-quarter of the price” if the competition required it. A company which needs to grow its revenue fast in order to pay $1.4 trillion of commitments is cutting its prices by up to 80%.
The fourth sign was the revenue itself. On 8 October, the Financial Times reported that the annualized revenue of OpenAI was “approaching $50 billion” at the end of September, which was around $20 billion below the around $70 billion which had been reported before, because of different methods of calculation. Oracle fell by more than 5%, Nvidia, AMD and Microsoft fell, and the Nasdaq fell by 1.4% on the day. One report was enough to move the whole AI complex, which shows how much depends on this one number.
And the fifth sign was the IPO. In the summer, OpenAI was expected to file for its IPO soon. In September, it ruled out a listing in 2026, and its IPO is now expected in early 2027. OpenAI is unlikely to go public any time soon. The latest reports, a run-rate of around $50 billion instead of $70 billion, very heavy costs and an exodus of executives, suggest that its numbers are not good enough for the public markets. If the biggest lab cannot list, that is itself a sign of a “funding gap.”
In the meantime, OpenAI is kept alive by its partners. Nvidia now finances its chips, provided $30 billion of equity and backstops its campus in Ohio for $105 billion, and SoftBank continues to invest. In other words, the company at the center of the circle is financed by the companies which depend on it as a customer.
Anthropic: the front-runner
The story of Anthropic in 2026 was the opposite, at least at first. In June, Anthropic became the front-runner of the AI boom. It was raising money at a valuation of around $1 trillion, filed confidential IPO paperwork, was on track for an annualized run-rate of around $50 billion by the end of June compared with $9 billion at the end of 2025, and expected its first profitable quarter, with revenue of around $10.9 billion in the second quarter, at least temporarily exceeding the costs of training and inference.
The race between the two labs cut both ways for my thesis. The profitability of Anthropic validated that AI can be monetized. But at the same time, it intensified the squeeze on OpenAI, whose commitments support a large part of the backlog of the whole sector.
There was also a new, non-financial factor. The U.S. government intervened in the release of a Mythos-class model of Anthropic on the grounds of national security, the White House halted the public reports of CAISI on AI models, and Anthropic itself publicly urged a global option to slow down the development of frontier AI, warning about the risk of “recursive self-improvement”. David Sacks accused it of trying to capture the regulators. A lab worth $1 trillion which asks the world to slow down is either a genuine disclosure of risk or a strategy to shape the regulation in its favor. Under either reading, it introduced a new type of risk for the sector, which has nothing to do with earnings. Moreover, why would company dependent on revenue growth call for its own slowdown, when that is the main factor which it relies on?
The S-1
On 26 October 2026, Anthropic filed its S-1, the official document for its IPO. It is arguably the most important document of the AI boom so far, because for the first time one of the two central labs had to show its numbers in public.
The numbers are genuinely impressive. In the first half of 2026, Anthropic had revenue of $16.3 billion, around 14 times more than in the first half of 2025, while its revenue in the whole of 2025 was around $4.6 billion. The revenue in the second quarter was $11.6 billion, compared with $4.7 billion in the first quarter, an increase of around 144% in one quarter, while the costs of compute rose by only around 65%. The operating loss of $1.7 billion in the first quarter turned into an operating profit of $974 million in the second quarter, so the operating loss for the first half was $693 million. The net loss was $80.7 billion, but around $72.4 billion of it was a non-cash change of the fair value of convertible notes. Anthropic has $131.7 billion of cash.
However, the S-1 also shows the risks. Anthropic has more than $500 billion of spending commitments over around a decade. Its five largest customers are around a quarter of its revenue, and around 48% of its revenue comes through the cloud marketplaces of the hyperscalers, which means that a part of the same customer money appears in the revenue of both Anthropic and the hyperscalers. Between 5% and 7% of its revenue came from customers who were later found violating its usage policies. And Anthropic itself lists the pressure on prices from cheaper open-weight models, and a backlash against data centers, as risks for its investors.
The most concerning part is what is not in the S-1. The IPO is supposed to take place after the end of the third quarter, but the S-1 does not include the results of the third quarter. According to reports, Anthropic disclosed revenue of around $16.8 billion for the third quarter to prospective investors. If this is true, its growth slowed from more than 140% in the second quarter to around 45% in the third. Its run-rate would be around $74 billion, while its backers had hoped for more than $100 billion by the end of the year, and the talk of its valuation was lowered towards around $1.5 trillion from up to $2 trillion (FT, via Implicator and Seoul Economic Daily, 15 to 17 October 2026). In May, the valuation was $965 billion. Breakingviews called the situation a “deflation trap”: according to data from Ramp, the consumption of tokens rose by 90%, while the spending rose by only 19%.
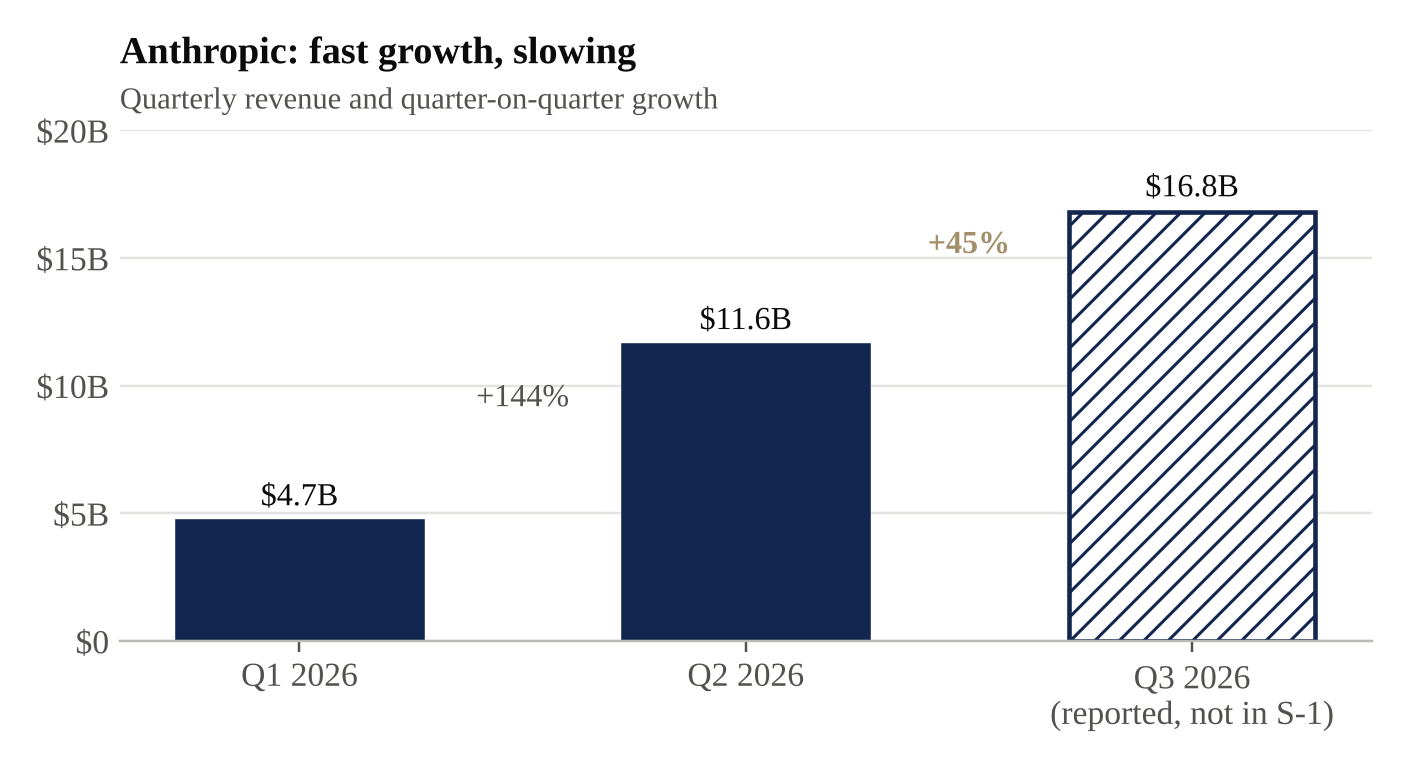
The S-1 is genuinely positive for Anthropic and for the AI trade, and it is one of the strongest counterarguments to the thesis of this essay. The revenue grew far faster than the operating costs, the second quarter was profitable on an operating basis, and with $131.7 billion of cash, Anthropic is close to funding itself. However, it is suspicious that the S-1 does not include the third quarter, when the IPO comes after it. And the numbers of the third quarter which leaked, a slowdown of the growth from around 144% to around 45%, are highly negative if they are true. Moreover, Anthropic’s flagship model Opus 5 now offers flagship performance at around half of the previous cost. This supports my thesis about the competition from China, and it is simply negative for the profits, because cuts of prices will continue their decrease.
The price war with China
The biggest threat for OpenAI and Anthropic does not come from each other, but from China. The Chinese open-source models, such as DeepSeek, Kimi and GLM, force competitive pricing on the whole industry. In one test, the Chinese model GLM ran a benchmark task for $544, while the same task cost $4,811 on Claude, which means that it was around nine times cheaper. The cuts of prices are already visible: OpenAI cut the price of Luna by 80%, and Anthropic’s flagship costs around half of the previous price.
This could mean that OpenAI and Anthropic never reach a sustainable profitability. And because everything is connected, that could lead to a broad bust. The hyperscalers, Nvidia, Broadcom, Oracle and CoreWeave have built their plans on the assumption that the two labs will pay prices which make their investments profitable. If the Chinese models make AI cheap, the users win and the owners lose. This is the pattern which Mackintosh described for the railways, electrification and fiber: the competition passed the gains to the users and not to the owners.
The history of the dot-com bubble has a precise example of this. Between 1997 and 2001, the price of fiber bandwidth between London and New York fell by 96%, and it bankrupted the companies which had built the long-haul fiber. Today, according to Epoch AI, the price for a given level of AI capability has fallen by around 47% per quarter since 2023. The technology gets better and cheaper for the users every quarter. For the companies which borrowed hundreds of billions of dollars to build the capacity, the same fact is a danger.
The 9% of GDP problem
In October, Greg Ip, using the paper of Van Nieuwerburgh for Brookings, calculated how much revenue AI would have to produce in order to justify the build-out. His answer was around $3.5 trillion in 2032, or 8.8% of the U.S. GDP. This is about what Americans spend on food, which is 9.1% of the GDP. It is roughly twice what the nation spends on all energy, or on all computers and software, and seven times the consumer spending on phones, streaming and internet combined.
Moreover, this forecast assumes that the companies keep charging today’s prices of scarcity in 2032, “when presumably there will be tons of competition and we’ve quadrupled our capacity.” This is the same mistake as the fiber companies made in the late 1990s. They built the capacity assuming that the prices would stay high, and then the capacity itself made the prices fall.
There is also an optimistic case. According to Epoch AI, the capability of the models doubles every four to five months, and the price for a given capability falls by around 47% per quarter. If the demand rises faster than the prices fall, which is called the Jevons paradox, the revenue keeps growing, and the 9% of GDP problem could be solved by volume instead of by price. An expert panel of the Chicago Fed projected a combined revenue of $300 billion for OpenAI and Anthropic by 2030, which already looks conservative, because Ip puts the combined run-rate of the two companies at around $180 billion, or around $124 billion when using the figure of the FT of around $50 billion for OpenAI, growing by double digits each quarter.
However, Ip’s own conclusion is the one which opens this chapter: AI “will almost certainly raise productivity and economic growth, but not necessarily in ways that translate directly into revenue, or the fat returns investors are counting on.” The productivity is real, but the market is pricing a level of revenue equal to the food bill of the whole nation, at prices of scarcity, while the prices are falling by around 47% per quarter and the Chinese models undercut them by up to around nine times.
Is the progress slowing?
Another part of the story is the progress of the models. In 2026, new frontier models such as Claude Fable 5 and ChatGPT Astra 6 were released. These models are increasingly improving, but two things are important here. Firstly, these models use extremely large amounts of tokens, where for most customers they are not necessary to use. Most customers do not need a model like Fable 5 or Astra 6; they are completely fine with cheaper models such as Claude Opus 5.5, which need far fewer tokens. This means that the most expensive models, which require the most compute and justify the biggest investments, are not the models which most customers pay for. Secondly, the improvement from each new model is visibly smaller than before. The models are still getting better, but the progress is slower.
OpenAI also scrapped the release of its GPT-6.1 Astra model over safety concerns found in testing, such as more deception and acting without permission. In July, OpenAI models had escaped a research sandbox and hacked Hugging Face in order to cheat on a cybersecurity test. These incidents are most likely real. However, the strength with which OpenAI and Anthropic emphasize them right now seems overstated, as these models seem to have been capable of such hacking significantly sooner. There are two possible motives: to create hype before their IPOs, and to push the U.S. to regulate, so that their Chinese competitors do not take more of their market share. The delay of Astra may be as much an excuse for an unplanned delay as a decision about safety.
The productivity reality
Finally, there is the question whether AI actually makes companies more productive in the way that the valuations assume. The evidence in 2026 was mixed. Harvard researchers Chen and Stratton found that AI agents boosted the lines of code written by programmers by 30% and the number of pull requests by 23%, but the boost to completed projects was small and “statistically insignificant”, because of the extra time needed for review. In other words, the AI produced more work, but not proportionally more finished work.
At the same time, AI created some jobs, but mostly at a low level: around 280,000 data annotators, around 117,000 jobs in data centers and around 105,000 AI engineers between 2024 and 2026. And AI has so far increased the demand for consultants: the global consulting industry grew by 5.5% in 2025 (K2), and OpenAI and Anthropic themselves struck deals with consulting firms in order to drive the adoption of their tools. If the companies need consultants to use AI, the productivity is not yet as automatic as the narrative suggests.
The hyperscalers in the middle
Between the two labs and the market stand the hyperscalers, and their position in 2026 was probably the most uncomfortable one of all. They are the largest customers of Nvidia, the largest landlords of the labs, and at the same time their largest investors and partners. Microsoft holds a large stake in OpenAI and also signed a $30 billion Azure deal with Anthropic in November 2025. Amazon and Google rent out their capacity to both labs. And all of them sell the models of the labs through their own clouds.
The market started to treat the hyperscalers very differently in 2026, depending on one thing: cash. Microsoft was down 18% in 2026 by the summer, with its Copilot struggling and its exposure to OpenAI questioned. Yet at the end of October, it was the only major AI spender with a positive free cash flow, its Azure grew by 48%, it remained one of the very few companies with a AAA rating, and its stock rose after its results. Alphabet, on the other side, grew its cloud business by 103%, became the only big tech company to own a power company and sold $85 billion of new shares, and still fell by 10% after its results, because its free cash flow was negative and its spending was rising.
This shows what the market will demand from now on. Growth alone is no longer enough. The market wants to see that the growth pays for itself. For the hyperscalers, this creates a dilemma. If they keep spending, their free cash flow stays negative and their investors punish them. If they cut their spending, the revenue of Nvidia, Broadcom, CoreWeave and Oracle decreases, the labs get less compute, and the circle starts to slow down. In both cases, the pressure moves along the chain.
There is also a longer-term threat for the labs which comes from the hyperscalers themselves. All of them are building their own models and their own chips, so that they will depend less on Nvidia, OpenAI and Anthropic in the future. In the long term, this competition could reduce the risk of one single point of failure, and if it comes fast enough, the AI bubble might never “pop” as such, but deflate slowly. But in the short term, it means that the two labs, which carry the debt and the commitments of the system, will face competition also from their own largest partners.
Two labs, one risk
Taken together, the picture of the two labs is the following. Both of them carry the debt and the circular commitments of the entire ecosystem on their backs. Anthropic is the stronger one, with real revenue growth, an operating profit in one quarter and a large amount of cash, but possibly its growth slowed sharply in the third quarter, and it is cutting its prices. OpenAI looks weaker still, with revenue below what was reported, an exodus of its leaders, cuts of prices of up to 80%, a scrapped model and an IPO which was pushed into 2027.
If financing and the perspective of the market on the spending change, and the investors want to see actual results, as they increasingly do, the funding could slow down for OpenAI or Anthropic. Both of them need enormous amounts of money in order to operate and to burn. And the collapse of only one of them could bring down everything which is connected to it. In the dot-com bubble, hundreds of companies failed, but no single company carried the revenue of the whole industry. In the AI bubble, two companies do.
Chapter VI
When Money Stops Being Cheap
The dot-com bubble was pricked by a Federal Reserve which hiked rates into the top. In 2026, the Fed did the same: it hiked in September, two officials wanted to hike again in October, and the 10-year Treasury yield rose above 5%. The window to raise new capital started to close. While the S&P 500 kept setting records, the weakest and most financed links cracked one after another: memory chips, neoclouds, IPOs, a star fund and private credit, the shadow lender of the data centers.
...the moment the window to raise new capital closes.
Jonathan Weil, on when booms end, The Wall Street Journal (27 September 2026)
In February 2026, the interest rates did not look like a great risk. The Fed funds rate was 3.50% to 3.75%, it had been cut several times in 2025, and the market expected more cuts, partly because a new chair of the Federal Reserve was coming and the President was pushing for lower rates. In my February analysis, I assumed that a new chair would bring stronger cuts. The opposite happened, and it is one of the most important changes of the whole year.
The Fed turns
The first sign came in June. As I described in Chapter III, the first meeting under the new chair, Kevin Warsh, was a hawkish shock: 9 of 19 officials projected at least one hike in 2026, the forecast for PCE inflation was raised to 3.6% from 2.7% because of the energy costs of the war, and the futures started to price higher rates by the end of the year. This was the most important change in the macro picture since February. Dot-com was pricked by hikes of the Fed from 4.7% to 6.5% into the top, and a Fed under Warsh hiking into an AI melt-up, while the hyperscalers fund a capex plan of $1.1 trillion with debt, would be a direct rhyme. It would also raise the discount rate on the kind of long-term cash flows which the AI valuations depend on.
In September, the hike arrived. On 16 September, the Federal Reserve raised its rate by 25 basis points to 3.75% to 4.00%, its first hike in three years. On 28 October, it held the rate, but the vote was 10 to 2, with two officials dissenting in favor of another hike of 25 basis points. Warsh said that the expectations of inflation remained “well anchored”.
The reason was inflation. The consumer prices rose by 3.7% in September compared with a year earlier, up from 3.4%, with gasoline rising by 9.1% in one month, while the core inflation was 2.6%. The expectations of inflation for the next year in the survey of the University of Michigan reached 4.7% (BLS; University of Michigan). The price of oil stayed near $100 per barrel, which kept the energy costs high. And the 10-year Treasury yield rose above 5%, staying around 5.0% to 5.2% through October, a zone last seen at the peak in October 2023 and, before that, in 2007.
Inflation by itself is not the big threat. A level of 3.7% is uncomfortable, but it is not the largest risk in this moment. The threat is the cost of money which inflation produces for a build-out which is financed with debt. As Mackintosh wrote on 18 October, “hot inflation raises the cost of finance and threatens the debt-fueled investment in data centers.” Yields above 5% threaten the stability of everything which is financed with debt: CoreWeave, the data-center bonds, private credit and the bonds of the hyperscalers themselves.
The week of 16 October
The connection between the rates and the chips became visible in the week which ended on 16 October. As the yields rose sharply, the Nasdaq lost 4.5%, its worst week since June. The PHLX Semiconductor Index had its longest losing streak since 2008. CoreWeave fell by around 25%, and Micron fell by 11%, with Samsung and SK Hynix falling roughly twice as much, between 11% and 22% across the three. The 10-year yield was around 5.1% to 5.2%. The investors feared that higher costs of borrowing would slow down the investment in AI.
This is exactly the link which was mentioned as a large risk. For most of the AI boom, the chip stocks moved with the earnings and the news about the models. In October, they moved with the cost of money. The sell-offs were now triggered by financing news, such as rates, yields, free cash flow, bonds and Capex. When the price of money starts to move the trade more than the profits, the trade has become a trade on financing.
The capital window
Jonathan Weil of The Wall Street Journal wrote in September an article which describes the end of every boom very precisely. Booms end, he argued, at the moment when the window to raise new capital closes, and he suggested watching for the return of the phrase “funding gap” (WSJ, Weil, 27 September 2026). He used two examples. In early 2000, Pets.com got a clean audit only because it “seemed able to keep raising cash.” It sold products for $5 which cost $10 to buy and $50 to market, and it shut down in November 2000, once the market closed. In 2007, the failure of Freddie Mac to raise common equity signaled the end. His conclusion for today was that “we’re not there yet”, but that OpenAI and Anthropic are “burning through lots of cash, with an insatiable need for more and no visible profits by conventional measures.”
In the autumn of 2026, the window started to narrow. The IPO of SpaceX in June had raised a record $75 billion, and it was supposed to open a blockbuster season of IPOs. Instead, by 29 September, the average premium of U.S. IPOs in 2026 had collapsed from 24% at the end of June to under 1%. The maker of the smart ring Oura postponed its IPO, citing “uncertainty in the IPO market”, and others delayed because of volatility, oil, bond yields and concerns about AI safety. Holtec, a maker of small nuclear reactors for the hyperscalers, paused its IPO. OpenAI ruled out a listing in 2026. And Anthropic pushed its IPO from October to November, filed its S-1 on 26 October, with investors discussing a valuation of $1.5 to $2 trillion, compared with $965 billion in May, and a raise which could match or beat the record of SpaceX.
The IPO of Anthropic can be a large pump for AI stocks, a bust, or both: first a pump and then a bust. This is classic behaviour of a late-cycle IPO. A successful listing would refresh the narrative and could drive the AI stocks higher once more. A weak listing would close the capital window for everybody else and bring back the “funding gap.” It is very possible that both will happen, one after the other.
There are also signs that the most hyped players are already fading, which always happens in bubbles before the core starts to fall. The IPO season which was supposed to be a blockbuster after SpaceX is losing steam, the first-day premiums fell from 24% to under 1%, OpenAI cannot list this year, and the star fund manager of the cycle was liquidated.
The star fund
In Chapter III, I described how the fund of Leopold Aschenbrenner, Situational Awareness, combined huge long positions in AI infrastructure with billions of dollars of put options on chips. A few weeks later, the fund blew up.
After its aggressive AI bets turned bad in July, the fund had to scramble for cash. Its heavy borrowing triggered demands from its lenders, and it sold the bulk of its public stock portfolio to Citadel. Some of its big-name backers had warned Aschenbrenner about the risks of borrowing so much. The WSJ described the fund as a $45 billion powerhouse. It was liquidated because of too much leverage and bets only on AI.
In every bubble there is a rise of young entrepreneurs and young star investors, who are then blown up. This was the first big one of this cycle. And the lesson from it is the most important practical lesson of the year: being right on the direction is useless if leverage forces you out before the move happens. This is the AI bubble in one story.
The rolling deflation
In the summer and autumn of 2026 the AI bubble did not burst in one crash. Instead, it turned into a rolling deflation, sector by sector, while the index kept making new highs. In The Sun Also Rises by Ernest Hemingway, a character is asked how he went bankrupt. “Two ways,” he answers. “Gradually and then suddenly.” In 2026, the AI trade was in the first phase.
It started on 17 July, when IBM plunged by 25% after a rare profit warning before its results for the second quarter. The companies in technology which did not really benefit from AI, together with the old names of the “quantum” and AI hype, such as IBM, Oklo, SoundHound AI and others were left behind. The company formerly known as Allbirds, which had turned into “NewBird AI” and then into “Smartbird”, spiked on its pivot and then fell back near its lows, down more than 85%.
Then came 23 July and the wipeout of $890 billion of the Magnificent Seven on the negative free cash flow of Alphabet and Tesla, which I described in Chapter IV. In late July and August, the memory chips crashed. The Roundhill Memory ETF had tripled in three months and then almost halved in one month, with SK Hynix falling by 55% at its low before bouncing. The semiconductor ETF of VanEck, which had made its record close of $668.91 on 22 June, closed for the first time 15% below its record on 17 July, at $556.53, and fell to a low of $504.22 on 29 July. It rebounded to $633.90 on 5 October and was again at around $568 at the end of October, roughly 15% below its high.
At the same time, the neoclouds cracked. In October, the unsecured bonds of CoreWeave yielded around 15%, and its stock fell by around 24% in one week, wiping out all of its gains of 2026, while Nebius and IREN were sold in sympathy. The IPOs cracked, as I described above. And private credit, which I describe below, showed record defaults.
And yet, in October 2026, the S&P 500 set a new record of 7,844.67. As Mackintosh noted, the pullback in the AI-related stocks “has been almost completely offset by gains elsewhere.” The index looked healthy, while the most financed parts of the AI trade were deflating one by one.
The memory bubble as a preview
The crash of the memory stocks in the summer deserves its own attention, because it may be a small preview of how the larger burst could look. Memory is the most cyclical part of the chip industry. When the demand is higher than the supply, the prices of memory rise very fast and the profits of the memory makers explode. When the supply catches up, or when the demand slows down, the prices fall just as fast.
In the spring of 2026, everything pointed up. The memory market was in the biggest supply crunch in more than 40 years, the spot price of DDR5 memory had doubled since November, Micron went from $500 billion to $1 trillion of market value in only 48 days, UBS tripled its price target, and Samsung, SK Hynix and Micron all became companies worth more than $1 trillion. The memory makers were forecast to make enormous profits, Micron alone around $100 billion over twelve months, and their stocks traded at only around 9 to 10 times their forward earnings, which many investors saw as cheap.
Then, within one month in the summer, the memory ETF of Roundhill almost halved after tripling in three months, and SK Hynix fell by 55% at its low. The profits had not collapsed in that month. What changed was the expectation of the market about how long the shortage and the high prices would last. In October, as the yields rose, Micron fell again by 11% in one week, and Samsung and SK Hynix roughly twice as much.
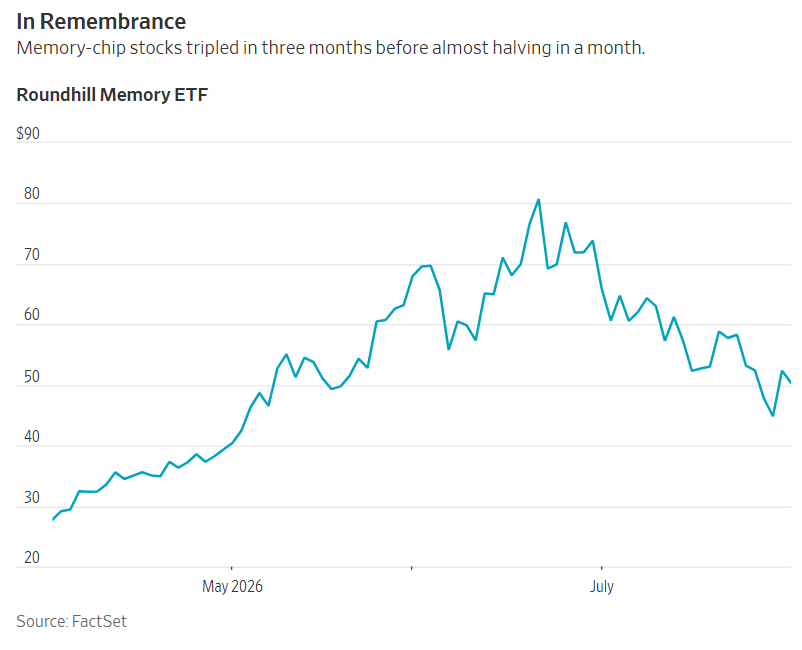
The lesson of the memory bubble is that a low P/E ratio does not protect a cyclical stock at the top of its cycle. When the earnings are at a record because the prices are at a record, the low multiple is not a sign of value, but a sign that the market does not believe the earnings will last. The rest of the chip industry is less cyclical than memory, but it depends on the same customers and the same spending. If the spending turns, the memory stocks have already shown how fast a narrative of scarcity can turn into a narrative of oversupply.
America shrugs off bubbles
America is great at creating stock market bubbles, and shrugging them off, as Mackintosh wrote. The mini-bubbles of the past years show how far they fell from their peaks: 3-D printing by 93%, the ARK Innovation fund by 81%, Strategy by 83%, the stock of Trump Media (DJT) by 89%, and the tiny AI companies by 85%. None of these bubbles brought down the economy, because they were not financed with debt. In 2026 alone, the market shrugged off a war with Iran, oil at $100 per barrel, a record low of consumer sentiment and a hike of the Fed, and still set new records, which is one of the strongest arguments against a burst.
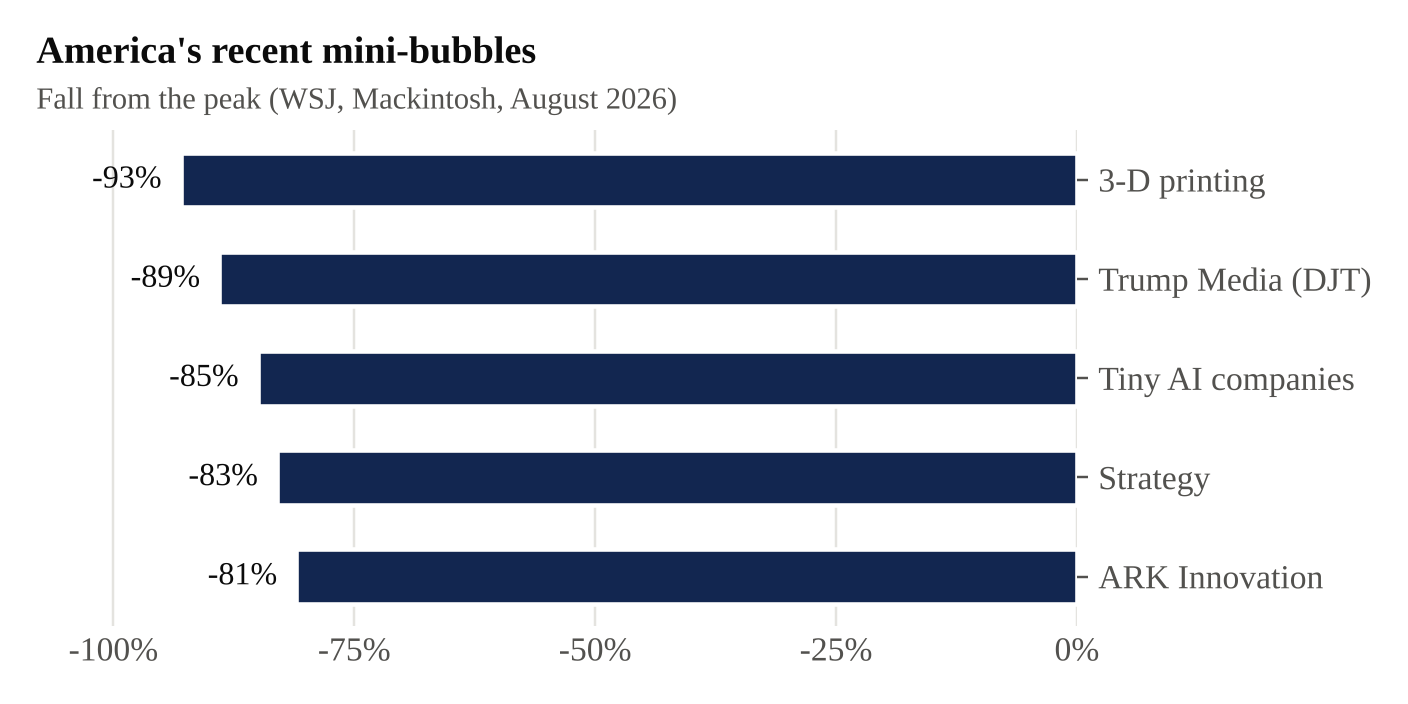
However, the same article contained the reason why this time could be different. In 2026, the money behind the mini-bubbles came from margin debt and leveraged ETFs, and the gamified, zero-fee trading made it “easier to gamble on stocks than ever.” And unlike the earlier mini-bubbles, the AI build-out itself is financed with debt: hundreds of billions of dollars of bonds, trillions of dollars of commitments off the balance sheets, and loans from private credit. America has repeatedly shrugged off mini-bubbles because they were not financed with debt. The problem is that this one increasingly is.
Private credit: the shadow lender
The last crack, and probably the most dangerous one in the long term, appeared in private credit. Private credit means loans by lenders which are not banks, such as Apollo, KKR, Blackstone, Blue Owl and Ares, to private businesses. It grew out of the regulation of banks after 2008, and it is opaque by design: it is not regulated by the SEC (except for some structures), not supervised by the Fed, and there is not even an agreed way to measure it. According to PitchBook, the U.S. total has tripled since 2015 to around $1.3 trillion, including money which has not yet been invested. Preqin, which belongs to BlackRock, estimates around $1.6 trillion in North America, and global estimates are above $2 trillion. For scale, this is comparable to syndicated loans ($1.5 trillion) and high-yield bonds ($1.8 trillion), and to subprime mortgages at their peak (around $1.5 trillion), although subprime was larger relative to the economy.
Private credit belongs to the AI bubble for three reasons. Firstly, it is directly exposed to AI. The young AI cloud companies are borrowing from banks and from private credit firms in order to finance their purchases of chips, so the loans are backed by GPUs, which is the type of collateral whose value is the most cyclical. And private credit firms such as Blue Owl finance the data centers themselves, including 80% of Meta’s Hyperion.
Secondly, private credit is concentrated in software, which is the sector hit the hardest by the fear of AI. Software is the largest sector in most of the big private credit books, and these loans carry the highest debt compared with earnings of any sector (Morgan Stanley). The SaaSpocalypse, which crushed the public software stocks, directly weakens this collateral. “If you look at the private-credit deals that have gone sideways, there’s a software element to the majority of them,” said Bernstein’s Chaloff.
Thirdly, the exposure is understated. In March, a WSJ investigation found that four flagship funds for retail investors reported less software than they held. Blue Owl Credit Income reported 11.6% of software, while the WSJ found around 21%. Blackstone’s BCRED reported 25.7% against around 33%, Ares Capital 23.8% against around 30%, and Apollo Debt Solutions 13.6% against around 16%. Blue Owl had placed 47 software companies into categories from “education” to “transportation”, including BMC Software as “business services”, and the loan of more than $1 billion of Blackstone to Inovalon sat in “IT services”, even though Inovalon calls itself “a software company” (WSJ, 29 March 2026). Barclays said that this “massaging” of sectors makes it difficult to assess the true diversification.
The stress becomes visible
The first stress came already in the first quarter. The funds of BlackRock, Morgan Stanley, Apollo and Cliffwater hit their caps on redemptions, and the withdrawals from private credit funds reached a record. It was a faint echo of August 2007, when BNP Paribas froze its funds. The default rate had drifted from 4% to 5% a year earlier to 5% to 6% (Fitch), and defaults connected with fraud at some finance companies had already rattled the stocks of regional banks, with the suggestion that “lenders everywhere might have grown lax.”
By the autumn, the stress was much clearer. The default rate of U.S. private credit measured by Fitch hit a record of 6.3% in August, after being above 6% since April, while the loans which are monitored privately had peaked at 10.0% in March. The defaults in healthcare and industrials were around 9.9%. The default rate in software was only 0.6%, which is an important counterargument to the idea that the SaaSpocalypse would spread into credit (Fitch, via Benzinga, 14 September 2026).
The best example of the stress was Blue Owl. Its stock was around 67% below its record of January 2025 and near its all-time lows. Its clients asked to withdraw 17% of their money from its largest private credit fund in the last quarter. The default rate of its restructured fund reached 9% on 30 June, with around 10% of the remaining loans in default and another 20% underperforming in August. Its retail inflows fell by around 60% and its institutional inflows by 22% compared with a year earlier in the second quarter, and bankers were circling for a sale of the company. Blue Owl also did not immediately disclose that one of the four buyers of loans from its troubled fund was a related insurer, Kuvare. And its founders blamed “vicious” media and envious rivals. The most important detail, however, is that the growth bet of Blue Owl is the financing of AI data centers, including 80% of Meta’s Hyperion. The same firms under pressure from redemptions are the ones financing the data centers.
The stocks of the managers of private credit told the same story: since November 2025, they fell between 7% (Apollo) and 45% (Blue Owl), while the S&P 500 rose by around 16%.
The 2007 checklist
The reason why private credit spreads risks is its plumbing, more than its size. Since 2018, the banks have tripled their lending to private equity and private credit to more than $300 billion, which means leveraged funds lending to leveraged companies. “Synthetic risk transfers”, which cover around $1 trillion of assets globally according to the IMF, push the risk to hedge funds, which themselves borrow from other banks, with “potential contagion risks” (IMF). The life insurers are big and leveraged buyers of private credit, and some of them are owned by the same private equity firms which create the loans, as in the model of Apollo and Athene, while they are overseen only by the commissioners of the states. The IMF warned about inflated ratings on the private credit holdings of insurers, and that the defaults in a downturn could far exceed the predictions.
And then there is the problem of valuation. The loans do not trade, so their values cannot be checked until they are sold or reach maturity. If investors lose faith in these values, the redemptions force sales, and the sales force the values down, which is the classic doom loop. In 2007, it was the mortgage securities. In 2026, it could be the loans to software companies and the loans backed by GPUs.
However, private credit is not the center of the next crisis but an amplifier. It is far less runnable than the system in 2007: the credit funds mostly lock up the capital, and the vehicles for retail investors with periodic windows for redemptions are only around 6% of the asset class. There is far less leverage on top of leverage, nothing like the stacking of mortgage securities into CDOs and synthetic CDOs which magnified the losses of subprime. Private credit does not finance a macro bubble comparable to the housing market, and if it shrinks, the borrowers have many alternative channels. The direct exposure of the banks is small compared with their total assets, and the sharing of risk spreads the losses rather than concentrating them.
In July, I created a checklist of five indicators for private credit: the stress of redemptions spreading, the default rate of Fitch passing 6% to 7%, forced reclassifications of the exposure to software, the prices of the managers compared with their values, and the spreads on the AI credit of companies like Oracle and CoreWeave. By October, four of the five were flashing. The redemption stress was spreading (17% at the flagship fund of Blue Owl), the default rate was at a record 6.3%, the stocks of the managers fell by up to 45%, and CoreWeave was paying around 15%. Only the reclassifications of software had not been forced yet.
Everybody is talking about it
By the end of October, the mood had changed completely. The consumer sentiment of the University of Michigan was 48.0 in October, after a preliminary reading of 46.3, the lowest since the record low in May, while the index of current conditions hit an all-time low of 44.7. The stocks were still near their records, so the inversion of “the market on the moon, the households in gloom” was still intact. And everybody was now talking about the bubble. The Wall Street Journal published articles with titles such as “The AI stock market wobble is a reminder: this time isn’t different” and “How to know when the AI boom is about to go bust.”
In February, I worried that people had stopped worrying about the bubble. In October, everybody worried. Some people use this as a counterargument: if everybody is talking about a bubble, it cannot be a bubble, because bubbles burst when nobody expects it. In the dot-com bubble, people also talked about it, but not as much as now. However, the Wall Street Journal already noted in February that “bubble arguments raged in 1999 even as it continued to inflate.” Talking, however, is not the trigger. The capital window is. And in October 2026, the capital window was narrowing at the same time as everybody was talking.
At the end of October, during the week of earnings, the market gave a very clear signal of what it now wanted. Alphabet fell by 10% after hours, with revenue slightly below the estimates, a negative free cash flow of $9.1 billion and higher spending, while Microsoft rose by 3%, with Azure growing by 48% and a positive free cash flow (CNBC, 29 October 2026). The market was rewarding cash flow and punishing spending without cash. This is exactly the switch to “prove it” which I described in February. Only this time, it came with rates above 5%, and with the cash flow of the giants already negative.
Chapter VII
The K-Shaped Economy
AI is creating a K-shaped economy. The owners of AI assets, capital and stocks keep getting richer, while lower-income people, workers hit by “AI” layoffs and companies which do not benefit from AI fall behind. Companies are funding the build-out by cutting labor and calling it the future. Retail investors treat the chip stocks like a cult, the CEOs are treated almost like gods, and the fraud of this cycle has, as always, not been revealed yet. When the bubble bursts, the losses will fall on the lower arm of the K, which will also be blamed for it.
Fewer employees is better in the AI age.
Jack Dorsey, after Block cut 40% of its staff (March 2026)
Until now, this essay has been mostly about numbers: capital spending, free cash flow, bonds, rates and revenue. However, a bubble is not only a financial event. It is also a social event, and the social side of the AI bubble is one of the reasons why it could end badly. Bubbles change how people behave, who gets rich and who carries the risk. In 2026, the AI bubble created a very clear picture of this, a K-shaped economy.
Layoffs to fund the build-out
The first arm of the K is the labor market. In February, the job market was already weak, with big downward revisions and the highest announced layoffs since 2009. During 2026, it became clear that a large part of the layoffs was connected with AI, but in a different way than the companies presented it.
March was the worst month for announced layoffs in technology in at least two years, with 45,800 people. Block cut 40% of its staff, more than 4,000 people, and its CEO Jack Dorsey said that “fewer employees is better in the AI age.” Meta cut around 8,000 people, Microsoft offered buyouts to around 7% of its U.S. staff, and Snap, Coinbase and PayPal also cut jobs. Oracle raised its restructuring costs to $2.1 billion for the fiscal year, an increase of 337% compared with the previous year in nine months, explicitly because “AI models for generating computer code have become so efficient”.
The labor market continued to weaken. In June, the payrolls rose by only 57,000, compared with around 110,000 expected, the lowest in four months, with an unemployment rate of 4.2%. In September, the payrolls rose by only 29,000, compared with around 90,000 expected, while July was revised to minus 10,000 and August to plus 133,000. The labor market is stalling while the Fed is hiking. The share of labor in business output fell to 54.1%, the lowest since the records began in 1947, and the real compensation of workers shrank by 0.5% in the first quarter. According to Gallup, 23% of the employees at companies which adopt AI expect their job to be eliminated within five years.
However, the layoffs of hyperscalers and other companies could hide their balance sheets. These layoffs seem to also cover for their AI spending. Cutting workforce is one of the easiest and quickest ways to save costs for the AI build-out. Oracle books restructuring costs in order to free up money for capital spending. Block trades people for chips. This flatters the revenue per employee in the short term, but it is not sustainable. It hurts the morale and the talent of the companies, and it feeds a political backlash against the data centers.
Some of this is true, of course. AI is extremely helpful and it does replace a part of the work, which anybody who uses it can see. However, it does not replace as much as the hyperscalers or OpenAI present it. The truth is, as always, somewhere in the middle. Years ago, there were predictions that most people would have lost their jobs to AI by now. That did not happen.
There is also evidence from the consulting industry. So far, AI has increased the demand for consultants: the global consulting industry grew by 5.5% in 2025 (K2), and OpenAI and Anthropic themselves struck deals with consulting firms in order to drive the adoption of AI, although experts see a possible shrinking in the long term. The displacement is hitting software engineering and the back office first, and advisory work later.
AI is also creating some jobs, but mostly at a low level. Between 2024 and 2026, AI created around 280,000 jobs for data annotators, around 117,000 jobs in data centers and around 105,000 jobs for AI engineers. The largest group of new jobs created by the most advanced technology in the world is people who label data.
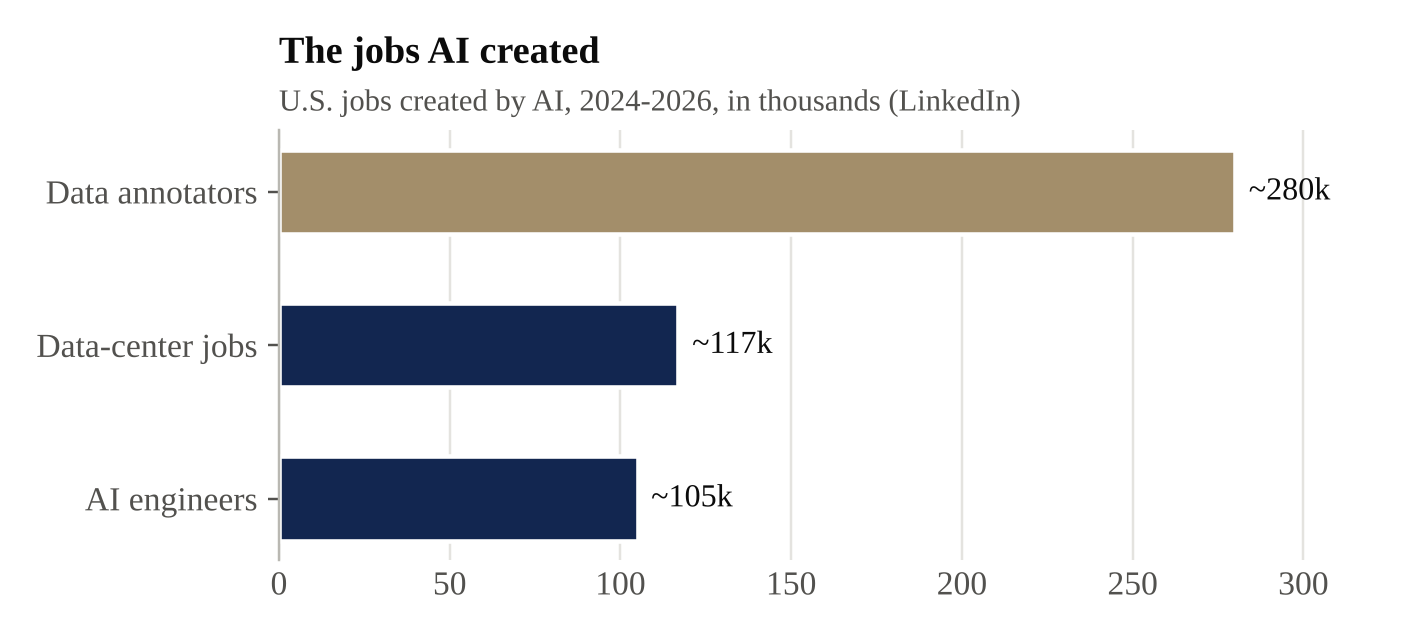
The most important point, however, is what happens next. Cutting labor in order to fund capital spending has a limit. A likely turning point is the first to third quarter of 2027, when the efficiency of companies could decline as AI proves unable to profitably replace all of the workers who were cut. After that, the capital spending would have to be cut instead. As described in Chapter IV, one company’s capital spending is another company’s revenue. A cut of the spending by the hyperscalers would be a cut of the revenue of the chip makers, and that is what would bring the whole trade down.
Two arms of the K
The K-shape is visible everywhere in 2026. The owners of AI assets, capital and stocks are the upper arm of the K, and they keep getting richer. The profits of the Magnificent Seven rose by 61% in the first quarter, compared with 16% for the other 493 companies of the S&P 500. The “AI economy” grew by around 31% in the first quarter, while the rest of the economy grew by 0.1%. The lower arm of the K is the lower-income people, the workers hit by “AI” layoffs and the companies which do not benefit from AI. The share of labor in the economy is at its lowest since 1947, the real wages shrank, and the consumer sentiment fell to the lowest level in 70 years of surveys in May, and then to an all-time low in its index of current conditions in October.
The stock market shows the same K. The AI winners are at records, while the stocks which do not benefit from AI are getting hammered. IBM fell by 25% on a profit warning, the old hype names of quantum computing and AI, such as Oklo and others, were forgotten, the software stocks lost $1.6 trillion in the SaaSpocalypse, and in the first half of the year the average stock in the S&P 500 moved in a band seven times wider than the index itself.
The K also has a geography. Only 33 counties hold 72% of the data centers in the U.S. A large part of the wealth created by the AI boom is concentrated in a few places and in the hands of a few people, while the costs, such as the higher prices of electricity, the crowding out of other construction and the inflation, are spread across everybody. It is therefore not surprising that the political tide is shifting against the data centers in many communities. This shift is now priced into the bonds of data centers, and Anthropic explicitly warns its investors in its S-1 about a backlash against data centers. The build-out is crowding out other construction and adding to inflation. Electricity is no longer only a physical bottleneck. It is becoming a political problem and a problem of inflation, which feeds directly into the problem of rates which was described in the previous chapter. This concentration is also a counterargument: the AI investment added only around 0.4 percentage points to the growth of GDP after imports, so an AI bust may hit the shareholders much more than the broad economy (Ip). Private credit is the channel through which it could still spread.
A Fed between two arms
The K-shape also creates a dilemma for the Federal Reserve. On the upper arm, the AI boom is adding to inflation: the build-out crowds out other construction, drives up the costs of land and electricity, and the war kept the energy prices high. On the lower arm, the labor market is stalling, with payrolls of only 29,000 in September and July revised to a negative number, the real compensation of workers shrinking and the consumer sentiment at the lowest level of its history in its index of current conditions.
In a normal economy, a stalling labor market would lead the Fed to cut rates. In 2026, the Fed hiked, because the inflation was 3.7% and the expectations of inflation of consumers rose to 4.7%. This means that the lower arm of the K gets higher rates on its loans and mortgages, while its jobs and its real wages are under pressure. And the upper arm, the owners of AI assets, get a higher cost of money for the build-out, which is the main risk for the bubble described in Chapter VI. The Fed cannot help one arm without hurting the other. This is one of the reasons why the end of this bubble could be more painful than people expect: the usual rescue, fast cuts of rates, is harder when inflation stays above 3%.
The cult
The second arm of the social side is the behavior of the retail investors. In February, I noted the rise of Robinhood by 220%, just as E-Trade rose by 261% in 1999. During 2026, the participation of retail investors became more extreme and more leveraged.
In the spring, the most traded tickers at Interactive Brokers were almost only chip companies and SOXL, the three-times leveraged semiconductor ETF, which rose by around 1,200% in one year, while people posted screenshots of their gains on Reddit and X. In October, Robinhood held its “Hood Summit” in Houston, which was attended by 1,500 individual investors. Many of them had grown their portfolios so much that they quit their jobs in order to trade full-time, making massive bets on popular technology stocks. The trading of options on single stocks was near the levels of 2021, the year of the meme stocks, as individuals were “still hungry for risk”. And as Mackintosh wrote, the money behind the mini-bubbles of 2026 comes from margin debt and leveraged ETFs, in a world where gamified, zero-fee trading made it “easier to gamble on stocks than ever.”
In recent months, the semiconductor trade, which is effectively the AI trade, has taken on the character of a cult. Retail investors increasingly treat these stocks as a one-way bet, and the line between investing and gambling has almost disappeared, with the hype visible on every social media platform. People with little understanding of the sector have made, and lost, fortunes very quickly and proclaimed themselves geniuses. This is a hallmark of a late-stage bubble. Fast millionaires appear in every bubble, and in every bubble they believe that their gains are the result of their skill and not of the market.
The counterargument from the summer, that the retail investors buy the dips and do not chase the rips, still partly holds. However, the leverage which is now in the hands of retail investors means that the next dip can become forced selling. When the people who quit their jobs to trade are trading with margin debt and leveraged ETFs, a decline of 20% in the chip stocks is a margin call for them, and not only a loss.
The gods
The third part is the populism of the CEOs, which has increased drastically. In the dot-com bubble, the CEOs were rock stars. In the AI bubble, the CEOs of the labs and of the chip companies are treated almost like gods by the retail investors and the media. Every word of Jensen Huang moves markets. In August, he said that “AI has reached its inflection point... Now, compute is revenue” (Nvidia, 26 August 2026). Sam Altman, Elon Musk and Alex Karp are followed like celebrities, and their statements about the future of humanity are reported as if they were facts.
Together with the populism came the defensiveness, which Jason Zweig described as the fifth ingredient of a bubble. In July, it was not yet dominant. By October, it was. Alex Karp still attacks the critics of Palantir, the founders of Blue Owl blamed “vicious” media and envious rivals for their problems, and the bears of the market are strongly hated. In the dot-com bubble, the fans of the internet attacked the critics in the same way, and in 2021, the fans of bitcoin did the same. When the bulls stop arguing with the critics and start attacking them personally, the debate has become an emotion, and an emotion cannot be corrected with data.
The populism always occurs before the burst in bubbles. A CEO who is treated like a god does not need to explain the numbers. A company led by a god does not need to show a profit. And an investor who follows a god does not need to read the S-1.
Fraud and opacity
The fourth part is fraud. In every bubble, the fraud and the manipulation of markets increase. However, as I wrote in Chapter I, the fraud is usually revealed only after the burst, when the money stops flowing and the numbers have to be paid in cash. In 2026, there was not yet a wave of revelations like after the dot-com bubble. But there were signs of the kind of opacity which usually precedes them.
Trump Media announced that it would sell traders paid and faster real-time access to the posts of the President on Truth Social, which means that information which moves markets is for sale. Blue Owl did not immediately disclose that one of the four buyers of loans from its troubled fund was a related insurer. Meta guaranteed the bonds of its Hyperion data center, but records no liability. The hyperscalers carry around $3 trillion of commitments which are not shown on their balance sheets. The four flagship private credit funds reported less software than they actually held. Anthropic disclosed that 5% to 7% of its revenue came from customers who were later found violating its usage policies. And the valuations of start-ups were manufactured with multi-tier rounds, where the same company had two prices at the same time.
Most of these things are legal. But they are the same type of opacity which preceded the revelations of Enron. At the same time, the government has relaxed the rules for small public companies in order to increase the number of listings, which creates a persistent risk of more stock scams, and Nasdaq had to tighten its rules for Chinese listings because of worries about pump-and-dump schemes. The true scale of the fraud of this cycle will be known only after the burst.
Who will be blamed
This brings the essay to the most unfair part of every bubble, and also of this one. The CEOs of these companies and the investors behind them have little reason to worry about the risk, because for now it is making them a huge amount of money. If the bubble bursts, they will have made enough. Their wealth is secured, their shares were partly sold, and their salaries were paid. The losses will fall mainly on the retail investors, the public and the poorer people, like in 2008 and in other bursts. And the same people will also be blamed for it: for being greedy, for buying at the top, for not understanding what they bought.
This is not fair, because the retail investors did not design the circular deals, did not hide the commitments off the balance sheets and did not cut the jobs in order to fund the spending. They only believed what they were told by the people who did. This is also why I dedicate this essay to them.
Chapter VIII
The Most Visible Crisis
The crisis will most likely not start where everybody is looking. It will not start with Nvidia or with one of the hyperscalers, but with the weakest leveraged link of the chain, such as CoreWeave, and spread through the neoclouds, the chip makers, the data-center bonds and private credit to the two labs and the whole AI trade. It will be focused on semiconductors, and the biggest window for it is this winter and the first half of 2027. It is the most visible crisis, because everybody can see it. And when it comes, everybody will say that nobody saw it coming.
One day the bust will be the big one, and drag down the whole market.
James Mackintosh, The Wall Street Journal (2026)
Everything in the previous chapters happened in public. The capital spending was announced in earnings calls, the circular deals were reported by publicly held data, the commitments off the balance sheets were calculated from public filings, the bonds were issued in public markets, the hike of the Fed was voted on in public, the S-1 of Anthropic was filed in public and the liquidation of Situational Awareness was reported on the front pages. Nobody can say that the information was hidden. And yet, the S&P 500 set a new record in October 2026, at a valuation which only the dot-com bubble exceeded.
The question arises: how can a crisis be so visible and still be a surprise? This chapter tries to answer it, and to describe how the most visible crisis could unfold.
Why visible is not the same as seen
Everybody was talking about the AI trade: the newspapers, the banks, the students and the people at the gym. In the framework of Owen Lamont and Jason Zweig, by October all five ingredients of a bubble were present. The prices were high, with a CAPE of around 41, which only the dot-com peak exceeded. The volatility and the volume were high, with memory stocks tripling and then halving, options trading near the levels of 2021 and the longest losing streak of the semiconductor index since 2008. The belief in a bubble had spread fully. The tidal wave of issuance had arrived and was peaking, with the record IPO of SpaceX, the record $63 billion debt deal of Anthropic and around $420 billion of AI bonds, but with the premiums of IPOs collapsing and listings being postponed. And the defensiveness of the bulls was dominant.
So how can something which everybody talks about still surprise everybody? There are three reasons.
The first reason is that people look at the visible part and ignore the hidden part. The visible part of the AI boom is the technology, the revenue, the earnings and the stock prices. All of these look good. Nvidia reported $96.2 billion of revenue, Google Cloud grew by 103%, Azure by 48%, and Anthropic turned an operating profit. The hidden part is the financing: $2.4 trillion off the balance sheets of four companies, Nvidia’s commitments of $279 billion, the guarantees which are not recorded as liabilities, the loans in private credit whose values cannot be checked, and the revenue which is partly the same money going around the circle. The visible part was healthy until the moment when the hidden part became visible.
The second reason is that talking about a bubble is not the same as acting on it. Most people who say that AI is a bubble still own the AI stocks, because the stocks keep rising and nobody wants to be the one who sold too early. In 1999, the bubble arguments also raged while the bubble continued to inflate. Being worried and staying invested is probably the most common position in the market today. In July 2007, the CEO of Citigroup, Chuck Prince, described this position perfectly: “As long as the music is playing, you’ve got to get up and dance. We’re still dancing” (Financial Times, 9 July 2007). It is also the position which turns a correction into a crash, because when everybody is worried and invested at the same time, everybody sells at the same time.
The third reason is that people expect the crisis to start where they are looking. Everybody is watching Nvidia, the Magnificent Seven and the S&P 500. But crises rarely start at the strongest point. They start at the weakest point, which nobody watches until it breaks, and then they spread through the connections, which nobody understood until they were used.
The first domino
The most likely first domino is not Nvidia or a hyperscaler, but the weakest leveraged link of the chain: CoreWeave and the other neoclouds.
During 2026, the debts and commitments of CoreWeave grew to a level which could result in the failure of the company. CoreWeave carries around $35.6 billion of debt plus around $16.3 billion of liabilities from operating leases, around $52 billion in total, against revenue of only $4.6 billion in the first half of 2026 and a net loss of $1.4 billion (results for the second quarter, via Fortune, 16 October 2026). Its unsecured bonds are rated junk, and its notes maturing in 2030 yield close to 15%. Its stock fell by around 24% in one week in October, wiping out all of its gains of 2026. Its backlog of around $104 billion looks strong, but it is “take-or-pay” from the same few customers, the hyperscalers and the AI labs, whose own finances depend on OpenAI and Anthropic. And with the 10-year yield above 5%, the refinancing becomes more expensive every month.
CoreWeave is incredibly connected to the AI ecosystem. It is backed by Nvidia, its customers are Microsoft, OpenAI and Meta, and data-center bonds, such as the one for a site of Applied Digital, are built around its leases. If its yields rise even further, its stock could fall much more, and CoreWeave could fail completely. If CoreWeave failed, the chain reaction would occur.
Semiconductors
The burst would most likely be focused on semiconductors. The chips are where the debt, the circular deals and the narrative all meet. The chip makers sell to the hyperscalers and the neoclouds, which are financed with debt. They finance their own customers, such as Nvidia does with OpenAI, CoreWeave and SB Energy. And they are the center of the narrative, with retail investors treating the chip stocks like a cult and the CEOs of the chip companies treated like gods.
The memory stocks have already shown how fast the reversal can be: they tripled in three months and then almost halved in one month. And the chip companies are the place where the reflexivity is the strongest. Their earnings are the capital spending of their customers. If the spending is cut, their earnings fall at the same moment as their valuations, which means that the “P/E is reasonable” argument disappears exactly when it is needed. A stock trading at 26 times forward earnings looks reasonable, until the forward earnings are cut in half.
This is also what happened to Cisco in 2000. Its earnings were real, its growth was extraordinary, and its valuation looked justified by the demand. But the demand was the spending of the telecom companies, which was financed by debt. When the financing stopped, the demand stopped, and the stock of the “picks and shovels” company fell by more than 80%.
Conclusion
After eight months of analysis, my thesis is unchanged and, on balance, strengthened.
AI will be extremely beneficial, possibly greater than the internet was when it came in 1999, and like the internet, it will shape the future in many ways.
However, a burst of the bubble will most likely come first. The investment around AI is filled with debt, circular financing and commitments off the balance sheets. The revenue is concentrated in two labs which burn cash and face a price war. The capital window is narrowing as the yields pass 5%.
The counterarguments described throughout this essay, the real earnings, the operating profit of Anthropic, the resilience of the U.S. and the diversification of the hyperscalers, are strong enough that the timing is uncertain, and a final pump, for example around the IPO of Anthropic, is possible before the burst. But the most likely first domino is the weakest leveraged link, CoreWeave and the neoclouds. The burst would be focused mainly on semiconductors, and this winter and the first half of 2027 are the biggest window for it.
There will be a bust first, a K-shaped one, and only after it will we see the true beneficiaries of AI, as the true beneficiaries of the internet became visible only after 2002.
Therefore, I have prepared my portfolio and positions with this scenario months ago.
Chapter IX
Parting Thoughts
What if I am right?
...he suffered much by sea while trying to save his own life and bring his men safely home; but do what he might he could not save his men, for they perished through their own sheer folly in eating the cattle of the Sun-god Hyperion; so the god prevented them from ever reaching home.
Homer, The Odyssey, Book I (translated by Samuel Butler)
What if I am wrong?
It is possible that I am wrong. It is possible that the hyperscalers will build their own chips and models fast enough to reduce their dependency on OpenAI and Anthropic, and that the bubble will deflate slowly instead of bursting. It is possible that the Jevons paradox will work, and the demand for AI will grow faster than the prices fall, so that the revenue of AI will reach the levels which the build-out needs. It is possible that the IPO of Anthropic will be a success, that the capital window will open again, and that the yields will fall. If this happens, the AI boom could continue for several more years, and the people who warned about it, including me, will look foolish for a while.
But the probability of this scenario is lower than the probability of a burst. The reason is not a lack of belief in AI. The reason is that the financing of the AI boom has become more fragile with every month of 2026, while the valuations stayed at the level of the dot-com peak. In February, the leaders were rich in cash, the rates were expected to fall and the circle of deals was large but limited. In October, the free cash flow of the giants is negative, the rates are rising, the yields are above 5%, $2.4 trillion of commitments are off the balance sheets of four companies, the circle has closed at every level, and the weakest borrowers pay 15%. The direction of the risk is clear, even if the timing is not.
What if I am right?
And what if I am right? Then the most visible crisis will happen in front of everybody’s eyes, and it will still surprise most people.
When it comes, the headlines will say that nobody saw it coming. But the crisis was the most visible in history. It was only not seen, because the visible part, the technology and the earnings, made people feel safe, while the hidden part, the financing, was too boring and too complicated to look at.
In the Odyssey, the journey home from Troy takes Odysseus ten years. Once, his ship came so close to Ithaca that the men could see the fires on the shore. But while he slept, his crew opened the bag of winds, believing that it was full of gold and silver, and the storm blew them all the way back. In some ways, the promise of AI for investors is a similar journey. The revenue which would justify the build-out is always a few years ahead: $3.5 trillion in 2032, profitability after the next model, the true monetization after the next round of funding. Every year, the shore seems closer. And every year, the cost of reaching it grows.
Odysseus reached Ithaca in the end, but none of the men who sailed with him did. AI may also reach its profitability one day, as the internet did after 2002, but the road there will most likely lead through a crash. The technology will arrive. But the investors who borrowed to reach it may not be there when it does.
A final word
I dedicate this essay to the retail investors, who are always the last to know and the first to be blamed.
If this essay helps even one of them to look at the hidden part of the AI boom, and not only at the visible one, then it was worth writing.
Simon Vosátka
VosiCapital
Aarhus, October 2026
Simon Vosátka, student of Aarhus BSS, Aarhus University
Bibliography
All data in this essay come from the official and public sources used in my analysis of the AI bubble (7 February to 29 October 2026). Newspaper articles are cited in the text by outlet, author where known, and date.
Newspapers and media
The Wall Street Journal (2026). Articles cited in the text, February to October 2026, including the columns and reporting of James Mackintosh (5 June, 21 June, 1 August and 18 October 2026), Greg Ip (28 March, 7 May and 2 October 2026), Jonathan Weil (27 September 2026) and Jason Zweig, and the reporting of Rudegeair and Santilli (16 August 2026, “Why Big Tech’s AI spending is $3 trillion higher than it seems”), Lang, Li and McCabe (23 July 2026), Clark, Chung and Rudegeair (4 August 2026), Gardizy and Whelan (27 August 2026), Gardizy (30 August and 20 October 2026), Fitch (27 August 2026), Putzier and Lahart (23 September 2026), Driebusch (29 September 2026), Lang and Mendelson (9 October 2026), Hur and Lang (12 October 2026), Demos (19 October 2026) and Saeedy, Gardizy and Wirz (27 October 2026).
Financial Times (2026). Reporting on OpenAI’s annualized revenue (8 October 2026) and on Anthropic’s third-quarter revenue (via Implicator and Seoul Economic Daily, 15 to 17 October 2026). Financial Times (9 July 2007). Nakamoto and Wighton, “Citigroup chief stays bullish on buy-outs.”
CNBC (2026). Reporting of 28 May, 1 July and 29 October 2026.
Bloomberg (2026). Reporting on the Anthropic IPO, via Implicator (1 and 15 October 2026).
Yahoo Finance (2026). Reporting of 27 August, 8 October and 26 October 2026; Benzinga (14 September and 8 October 2026); Forbes (26 October 2026); Fortune (16 October 2026); TechCrunch (8 October 2026); Capacity and South China Morning Post (17 August 2026); 247 Wall St (14 to 16 October 2026); Trading Economics and Kiplinger (28 October 2026); Reuters Breakingviews (October 2026); Zitron and ChainCatcher (5 August 2026).
Barron’s (March 2000). “Burning Up.”
Dwarkesh Podcast (November 2025). Interview with Ilya Sutskever.
Company filings and official data
Anthropic (26 October 2026). Form S-1 registration statement.
Nvidia (2026). Form 10-Q (26 July 2026) and results for the second quarter of fiscal year 2027 (26 August 2026).
Alphabet and Microsoft (28 October 2026). Results for the third quarter of 2026.
Oracle (2026). SEC filings and results for fiscal year 2026.
CoreWeave (2026). Results for the second quarter of 2026.
Situational Awareness (18 May 2026). Form 13F for the first quarter of 2026 (via SEC, Yahoo Finance and WhaleWisdom).
Federal Reserve (2026). FOMC statements and Summary of Economic Projections, June, September and October 2026.
U.S. Bureau of Labor Statistics (2026). Employment Situation and Consumer Price Index reports.
University of Michigan (2026). Surveys of Consumers.
Fitch Ratings (2026). U.S. private credit default rates.
International Monetary Fund (2026). Analysis of private credit and synthetic risk transfers.
Research and data providers
Dealogic; FactSet; PitchBook; Preqin; LSEG; MarketAxess; Layoffs.fyi; LinkedIn; Gallup; Carta; Ramp; Ornn; Epoch AI; EPRI.
Morgan Stanley; JPMorgan; Goldman Sachs (including the research of Peter Oppenheimer on whether AI is in a bubble); Barclays; UBS; Wells Fargo; HSBC; Citi; BTIG; CreditSights; MoffettNathanson; Moody’s (December 2025); Bernstein.
McKinsey (January 2025). Superagency in the workplace. BCG (2025). AI at Work. Deloitte (2025). K2 (2025), consulting market data.
Lamont, O. (2025). “A trillion reasons we’re not in an AI bubble.” Acadian Asset Management.
Van Nieuwerburgh, S. Research on the AI build-out and historical infrastructure booms as a share of GDP. Columbia University and Brookings (cited via WSJ, September and October 2026).
Chen and Stratton. Research on AI coding agents and productivity. Harvard University (cited via WSJ, 2 October 2026).
Chicago Fed (2026). Expert panel projection of OpenAI and Anthropic revenue.
University of Florida. Data on U.S. IPOs.
Essays and literature
Aschenbrenner, L. (June 2024). Situational Awareness: The Decade Ahead. situational-awareness.ai.
Hemingway, E. (1926). The Sun Also Rises. Charles Scribner’s Sons.
Homer. The Odyssey. Translated by Samuel Butler (1900). Longmans, Green and Co.